Anyone who lives on a hurricane-prone coast or even watches television is familiar with the "
. It begins as a point at the current position of a tropical cyclone and expands to show the potential position of the storm's center in the coming five days. It is called the "cone of uncertainty" because the further out in time you go, the more uncertain the forecast becomes... and it tends to look like a cone!
(By the way, "
tropical cyclone" is a blanket term that refers to tropical depressions, tropical storms, and hurricanes.)
 |
| A "cone of uncertainty" for Hurricane Irma (left) and Hurricane Harvey (right). Both cones are from 2017 and are therefore identical to each other in their construction. |
The size of the cone is fixed for every forecast of every storm during an entire hurricane season, but the size slowly evolves from year to year. If the storm is moving quickly, the cone will appear more elongated and if the storm is moving slowly, the cone will appear more compact... but it's the exact same cone. The examples shown above are from Irma (left) and Harvey (right); both storms occurred in 2017, so both cones are identical in their construction.
The cone is updated each year prior to the start of hurricane season, and it almost always shrinks each year too. Hurricane track forecasts are
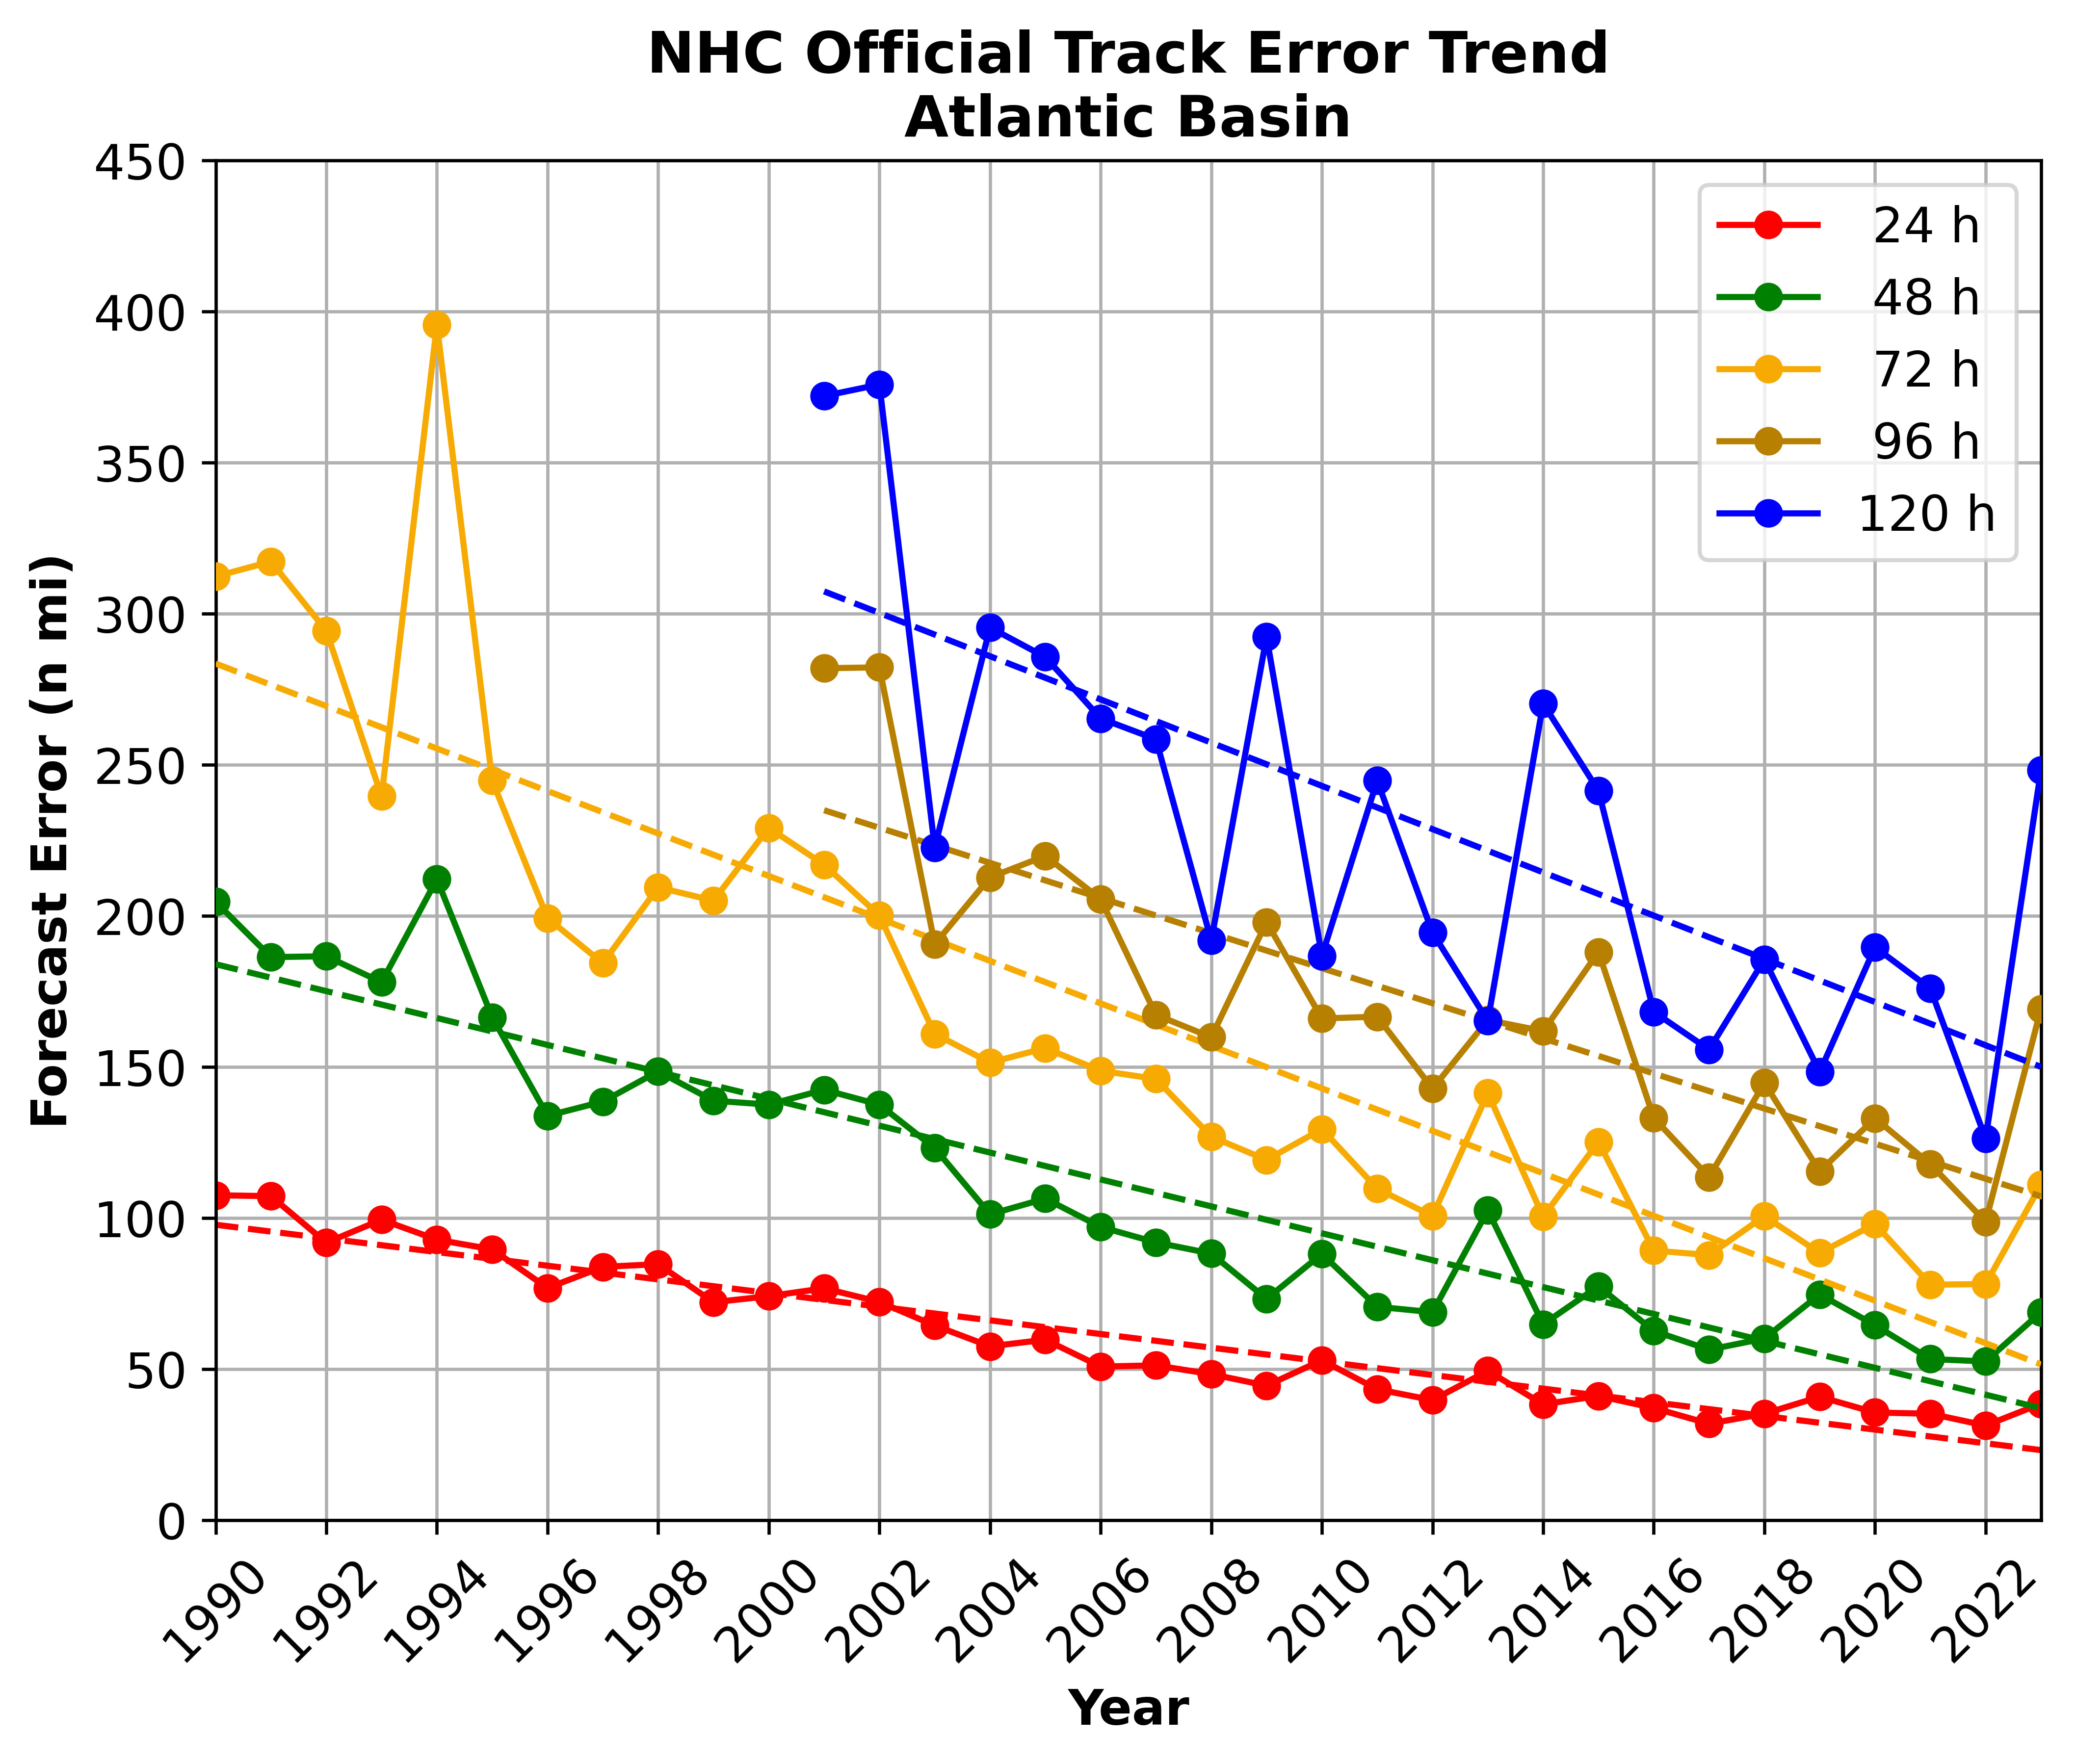
gradually improving, meaning that in general, there is less uncertainty where a storm will track now than there was a decade ago. In fact, a two-day forecast now is as accurate as a one-day forecast was a decade ago, and a five-day forecast now is more accurate than a three-day forecast was two decades ago!
The map below shows a sample satellite image with the new 2022 cone overlaid on the 2015, 2009, and 2003 cones for comparison. Improvements are getting increasingly challenging to achieve because there can never be a perfect forecast of a chaotic system like the atmosphere. We call this a "limit of predictability", and there will come a time when we reach it and meaningful improvements can no longer be made. Some would argue we are very close to -- if not already at -- that limit.

So just how is the size updated each year? The National Hurricane Center uses its own track forecast errors over the previous five years to calculate a circle at each "lead time" (1 day, 2 days, ... 5 days). The size of that circle is designed to enclose the position of the storm's center with 2/3 probability, meaning that there's historically a 1/3 chance the storm will track outside the circle at that time. Lines connecting the various circles complete the shape of the cone. [Note that the 2022 cone size is thus determined from track errors during the 2017-2021 seasons.]
Since the cone is so widely used yet sometimes misunderstood, here are some key refreshers:
- The cone does not tell you anything about where impacts will be experienced. Even for a perfect down-the-middle track forecast, impacts such as strong wind, heavy rain, storm surge, and tornadoes will extend beyond the cone. Cone graphics on the NHC website include some of the relevant watches and warnings, as shown in the examples at the top of the post.
- The cone does not tell you anything about the size of the storm. Regardless of how strong they are, hurricanes come in a wide range of sizes. Several years ago, NHC added the latest observed size of the wind field to their cone graphics to help illustrate this (see the Irma and Harvey examples above... the orange and red shading indicates the extent of tropical storm and hurricane-force winds at the time the forecast was issued).
- The cone does not tell you anything about the actual uncertainty associated with the forecast. Since the size of the cone is fixed, it cannot become more narrow or broad to accommodate a more or less predictable environment.
- Nothing magically happens at the edge of the cone. If a hurricane is approaching and you are scrutinizing each new forecast to see if you are inside the cone or not, you are missing the point of it. It is arbitrarily chosen to be the 67% historical probability threshold... a 75% probability cone would be larger, and a 50% probability cone would be smaller.
- If you use the cone graphics from NHC, there is some information about intensity provided. At each forecast point, there is a letter written inside the black dot corresponding to a general intensity range: D (tropical depression), S (tropical storm), H (hurricane (Category 1-2)), and M (major hurricane (Category 3+)). But keep in mind that there is uncertainty associated with the intensity forecasts too!
With that in mind, let's imagine what a cone of uncertainty for
intensity might look like. Consider this: averaged over the past five years (2017-2021), the mean error in a 1-day forecast is +/- 9 mph, the error in a 3-day forecast is +/- 14 mph, and the error in a 5-day forecast is +/- 18 mph. But there is also a wide range of values that go into those averages, meaning that there is a small probability of a very large error and a small probability of near-zero error.
To create the next figure, I simply averaged five years of intensity errors together such that the values listed for 2022 are based on the NHC's intensity errors during the 2017-2021 seasons (and 2021 used 2016-2020, and so on). This five-year averaging helps to mimic the smooth trends of the cone of uncertainty, but it is not a 2/3 probability like the track cone.
Now, using a hypothetical intensity forecast and the average error values for 2022, I created the following chart. This is what a cone of uncertainty for intensity could look like; a hypothetical intensity forecast is shown with the red line and the cone of uncertainty is the light red shading surrounding the forecast.
Some important terms:
Potential Tropical Cyclone: a disturbance (or "Invest") that is not yet a tropical cyclone, but is expected to become a tropical cyclone within the next 48 hours and produce tropical storm or even hurricane conditions on land. Watches and warnings such as those outlined below can be issued for a Potential Tropical Cyclone because of its anticipated impacts.
Storm Surge Watch: life-threatening inundation from rising water moving inland from the shoreline is
possible generally
within 48 hours.
Storm Surge Warning: life-threatening inundation from rising water moving inland from the shoreline is
expected generally
within 36 hours.
Hurricane Watch: sustained winds of 74 mph (64 knots or 119 km/hr) or higher are
possible. Because hurricane preparedness activities become difficult once winds reach tropical storm force, the hurricane watch is issued
48 hours in advance of the anticipated onset of tropical-storm-force winds.
Hurricane Warning: sustained winds of 74 mph (64 knots or 119 km/hr) or higher are
expected. Because hurricane preparedness activities become difficult once winds reach tropical storm force, the warning is issued
36 hours in advance of the anticipated onset of tropical-storm-force winds.
Tropical Storm Watch: sustained winds of 39-73 mph (34-63 knots or 63-118 km/hr) are
possible within the specified area
within 48 hours.
Tropical Storm Warning: sustained winds of 39-73 mph (34-63 knots or 63-118 km/hr) are
expected somewhere within the specified area
within 36 hours.
You can read about typical damage caused by hurricanes of all categories at
Saffir-Simpson Hurricane Wind Scale.
Strong winds and thunderstorms arrive well before the center of the storm (sometimes a couple of days!), so when the time comes, be sure to plan and finalize your preparations prior to the expected arrival of tropical storm force winds, not the expected arrival of the storm's center.
This year will be my 27th year of writing these blog posts. That's actually impossible to believe, but I hope the information and updates have been useful and educational. Thank you for your continued interest!



 Anyone who lives on a hurricane-prone coast or even watches television is familiar with the "cone of uncertainty" produced by the