24 November 2015

Hurricane Joaquin tops the list as 2015 Atlantic season comes to a close

To those who have been subscribed and reading my posts since the humble beginnings in 1996 (yes, this was the 20th year!), I want to thank you for your continued support and interest.  And to the many more recent readers, thanks for joining!

I have sent out approximately 1000 tropical updates over those years.  Those updates have spanned 285 tropical storms, 126 hurricanes, 66 major hurricanes, and 36 retired storm names.  WHEW... my fingers are tired just thinking about that!

My summary of the 2015 hurricane season is now available on the Washington Post's Capital Weather Gang blog, and again, thanks for reading and sharing!

Hurricane Joaquin tops the list as 2015 Atlantic season comes to a close


10 November 2015

Kate strengthens as it turns to the northeast

Tropical Storm Kate is now racing toward the northeast, away from the Bahamas, at nearly 20mph.  Peak winds are up to 60mph, and it is forecast to intensify more in the next 24-36 hours before it transitions to an extratropical cyclone.


It is being forced out to sea by a deep trough, which shows up nicely on water vapor images:


If Kate does reach hurricane intensity, it would join the ranks of only 39 other known hurricanes to form during November since 1851.  Typically by now, the Cape Verde season has long-since shut down (the easterly waves moving off of Africa), and the Gulf of Mexico is commonly influenced by cold fronts.  But the western Caribbean is a hot zone for formation, as well as along and on the ends of fronts.  In this map I show the tracks of the 39 November hurricanes as well as their formation point, which is marked with a white dot.  I added a cyan dot where Kate formed for reference.


Elsewhere, the basin is quiet, and the end of the official hurricane season is just under three weeks away.


28 October 2015

Vizcaya: a Miami gem in peril from sea level rise

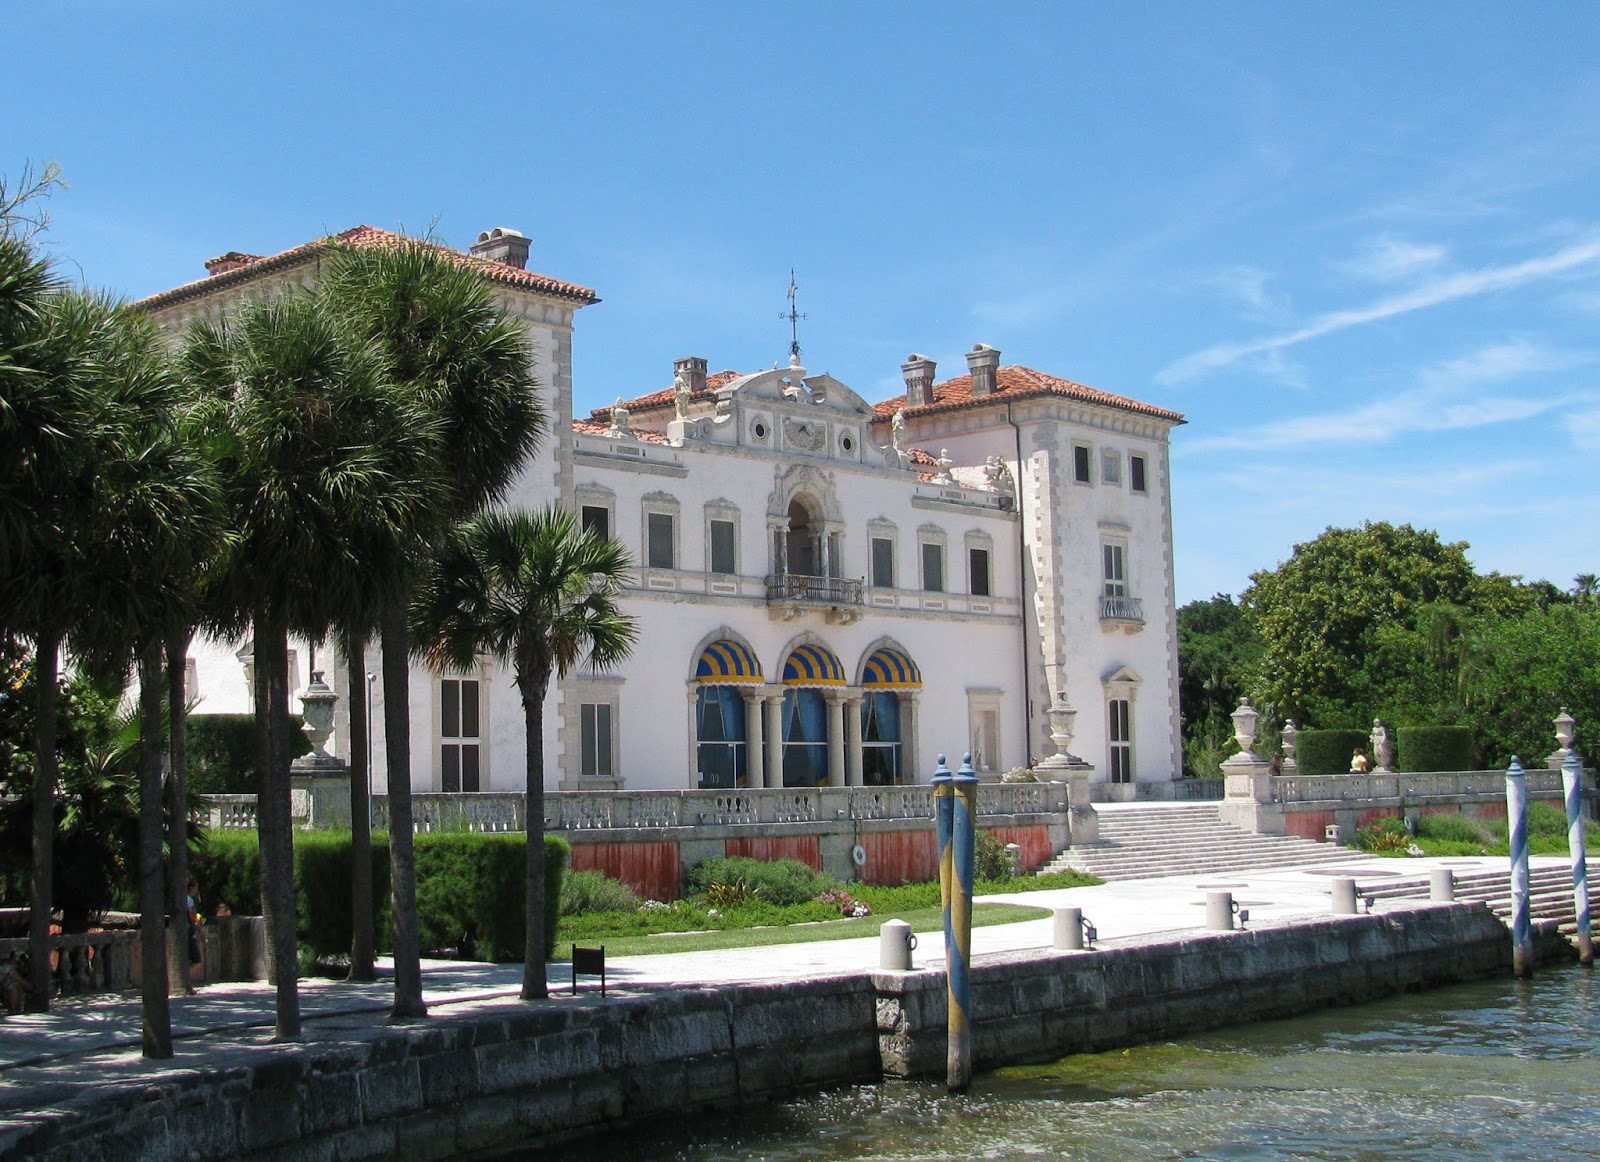
Bay/East entrance, July 2011. (photo by Brian McNoldy)
Villa Vizcaya was built in 1914-1922 by James Deering.  James was the son of William Deering, of Deering Harvester Company fame in the late 1800s.  James joined the company when he was 21, and when he was 43, J.P. Morgan facilitated a merger with McCormick Reaper Company to form International Harvester, which quickly became the largest agricultural equipment manufacturer in the country.

James lived in Chicago, and wanted a winter house in south Florida.  The pristine tropical coastline of Biscayne Bay near Miami was his chosen location (area map) for an immense 180-acre estate featuring manicured gardens, statues, and a mansion built in the Mediterranean Revival style.

Aerial view of the mansion, gardens, and stone barge in the bay entrance. (Google Earth)
James died in 1925 at age 66, and just one year later, the Great Miami Hurricane of 1926 severely damaged the property.  Efforts to restore it were set back again by the Labor Day Hurricane of 1935.  In the 1950s, James' heirs gifted the estate to Dade County, and it finally re-opened as Vizcaya Museum & Gardens for the public to experience and enjoy.  In 1979, it was added to the National Register of Historic Places, and remains a beautiful public museum today (Vizcaya Museum & Gardens website) despite subsequent destructive hurricanes such as Andrew in 1992 and Wilma in 2005.

One thing James couldn't have anticipated 100 years ago was that the spectacular bay-front location would be endangered by the bay itself.  Archeological work being conducted in downtown Miami by Robert Carr and colleagues recently "provided proof that sea level in the area had risen more than a foot in the last century" (Miami Herald article), and my own work with tide gauge data from nearby Virginia Key suggests that the sea level has risen nearly 4 inches in just the past 20 years, and that the rate of sea level rise is accelerating (RSMAS blog post).

So, I wanted to compare some photographs of the estate taken nearly 100 years ago to some taken during a "king tide" on October 28, 2015 from nearly the same vantage points.  With assistance from Remko Jansonius, Nydia Perez, and Emily Gibson at Vizcaya's Collections and Curatorial Division, the following comparisons offer some perspective on the rising seas that will threaten this unique and historic gem in the coming years and decades.

Front of the decorative stone barge in 1916 (top) and October 2015 (bottom).  Top photo is courtesy of the Arva Moore Parks Vizcaya Photograph Collection, Vizcaya Museum & Gardens.  Bottom photo by Brian McNoldy.


Side of decorative stone barge showing steps and statues of Hermes in 1917 (top) and October 2015 (bottom). Top photo courtesy of the Construction Photograph Albums, Vizcaya Museum & Gardens.  Bottom photo by Brian McNoldy.


Read more here: http://www.miamiherald.com/news/local/community/miami-dade/article11113340.html#storylink=cpy
Looking toward the north boat landing from the east entrance in January 1917 (top) and October 2015 (bottom). Top photo courtesy of the Construction Photograph Albums, Vizcaya Museum & Gardens. Bottom photo by Brian McNoldy.
Bridge to the north landing in 1917 (top, with gondolas) and October 2015 (bottom). Top photo courtesy of the Arva Moore Parks Vizcaya Photograph Collection, Vizcaya Museum & Gardens. Bottom photo by Brian McNoldy.
Bayfront view of Vizcaya from the north landing in 1917 (top) and October 2015 (bottom).  Top photo courtesy of the Construction Photograph Albums, Vizcaya Museum & Gardens. Bottom photo by Brian McNoldy.


For the next two photo comparisons, we fast-forward by 30-35 years to the early 1950s.

Bayfront view of Vizcaya from the north landing in 1950 (top) and October 2015 (bottom). Top photo detail courtesy of the Richard B. Hoit Photograph Collection, Vizcaya Museum & Gardens.  Bottom photo by Brian McNoldy.
Looking toward the decorative stone barge from the bayfront entrance in 1952 (top) and October 2015 (bottom).  Top photo detail courtesy of the Rudi Rada Photograph Collection, Vizcaya Museum & Gardens.  Bottom photo by Brian McNoldy.
Although the photos from 2015 were taken during a very high "king tide", that water level will soon enough be the new average, and then eventually the new low tide.  Sea level rise is happening, and will continue to happen at even greater rates than we've ever measured.  The last 4 inches of sea level rise took 20 years to occur, but the next 4 inches may only take another 10 years or less!

Some additional photos from the October 28, 2015 "king tide" are provided here without comparison, but set a benchmark for the next generation of Vizcaya photographers...

Gazebo on the south side of the bayfront entrance.  Photo by Brian McNoldy.
Only a few steps still remain above water on the bayfront entrance.  Photo by Brian McNoldy.
Close-up of the stone barge, which appears to be two separate features. Photo by Brian McNoldy.
An area of the secluded south landing. Photo by Brian McNoldy.


08 October 2015

State of the Season

Through October 8, the Atlantic has had 10 named storms, 3 hurricanes, and 2 of those became major hurricanes (Category 3+).  The strongest by far was Joaquin, the only depression to not become a tropical storm was TD9, and the shortest-lived storm was Bill.


The final advisory was just written on Joaquin last night as it transitioned to an extratropical cyclone, so I'll go over its fairly unique evolution.  Joaquin's origins could be traced all the way back to around September 17-18 as an upper-level low pressure system. While tropical development from upper-level "cold core" lows is not unheard of, it is rare for storms of that pedigree to become nearly Category 5 hurricanes.  Here is a quick timeline as a recap:

Sept 18: upper-level low identifiable
Sept 25: becomes disturbance of interest, or "Invest"
Sept 28: upgraded to tropical depression
Sept 29: upgraded to tropical storm
Sept 30: upgraded to hurricane
Oct 1: upgraded to major hurricane
Oct 3: strengthens to 135kts, just short of Category 5 status
Oct 7: weakens to tropical storm
Oct 8: final advisory written as extratropical cyclone

Water vapor images at select milestones in Joaquin's lifecycle leading up to its peak intensity.
Joaquin was the strongest hurricane in the Atlantic since Igor in 2010.  It was the first major hurricane to impact the Bahamas since Irene 2011.  It maintained hurricane intensity up to 40.5°N (same latitude as Long Island, NY).  In terms of Accumulated Cyclone Energy, or ACE, Joaquin racked up the same amount as all nine previous named storms combined!  That brings 2015 up to approximately 65% of an average season by this date... so still decidedly "quiet" overall.

Average seasonal cumulative ACE (purple) and 2015's accumulation so far (yellow).  
Even in distant 'model-land', the Atlantic looks quiet, and with a very strong El Nino in high gear in the central and eastern Pacific Ocean, tropical Atlantic activity should remain suppressed for the rest of the season.  However, suppressed does not necessarily mean dead.  October is historically still a month when extremely powerful hurricanes have formed and some of those made landfall.  As Joaquin proved, we can still get very intense storms even though the overall seasonal activity is below average.

Recent October hurricanes that reached Category 4-5 intensity are:
Gonzalo 2014
Omar 2008
Wilma 2005
Michelle 2001
Iris 2001
Mitch 1998


03 October 2015

Hurricane Joaquin finally moving northeast away from the Bahamas

Enhanced infrared satellite image of Joaquin and the U.S. east coast on Saturday morning.
Joaquin has devastated parts of the central Bahamas with nearly 2 feet of rain, destructive storm surge,  tropical storm force winds for 3 days, and hurricane-force winds for 1.5 days.  It will begin to clear up there today, so I'm sure we will start seeing more photos and videos of the aftermath.  The anticipated turn to the north happened on Thursday night, and a turn more to the northeast occurred later Friday.  The track history, as well as the current NHC forecast, is shown here:

The NHC forecast with the cone of uncertainty included is also shown for reference... note that Bermuda is now under a hurricane watch and a tropical storm warning.  Although the cone is exactly the same size it has been for every storm all season, the current model guidance consensus makes this forecast much more confident than it previously was.  A fixed-size cone is not capable of illustrating the evolving forecast confidence (see "Why the forecast cone of uncertainty is inadequate for Hurricane Joaquin").

Joaquin is now a Category 3 storm with maximum sustained winds of 125 mph, with a possibility of some strengthening today.  It will then weaken gradually over the coming days as it encounters higher shear and cooler water.  By the end of the week it is expected to transition to a strong extratropical cyclone.

Of course, the main event which has always been part of the forecast is the enormous rainfall totals along the U.S. east coast.  An endless feed of deep tropical moisture from Hurricane Joaquin is streaming into the Carolinas and mid-Atlantic states, and won't be stopping anytime soon.

South Carolina has been the bullseye for incredible rains, which isn't surprising when you see the graphic above showing the moisture plume persistently centered on that state.  The forecast through the end of the weekend is not good either... the flooding that is already happening will get much worse. Locations from South Carolina up to Maine are also experiencing coastal flooding due to onshore winds, but that is being caused by a mid-latitude storm system, not Joaquin.


The U.S. "dodged a bullet" with this storm.  If a major hurricane had stalled over south Florida for 3 days, it's hard to even imagine the outcome.  Or if it followed Sandy's path from three years ago, etc, etc.  The prospect of a U.S. landfall was never presented as a certainty by anyone (I hope).  There were times when the majority of model guidance as well as NHC indicated that the center could turn back west and hit the coast, but that should not be interpreted to mean that it was a sure thing.  Times like this are when scientists and forecasters hope to educate the public more about probability and uncertainty, and that a single forecast is not always enough.  Nature is just sometimes inherently less predictable than other times, the hard part is communicating that to everyone.

With Joaquin, this season has now had 10 named storms, 3 hurricanes, and 2 major hurricanes (Cat3+). The average for this date, using a 1981-2010 climatology, is 9 named storms, 4 hurricanes, and 2 major hurricanes.  However, in terms of Accumulated Cyclone Energy, or ACE, this season is running at just a little over 50% of average for this date because most of the storms that formed were so short-lived.


29 September 2015

Joaquin forms near Bahamas, could threaten northeast U.S.

On Sunday night, Tropical Depression 11 formed north of the Bahamas, and on Monday night it was upgraded to Tropical Storm Joaquin, the tenth named storm of the season.  It is currently centered about 400 miles north of the eastern Bahamas and is drifting west.


Joaquin actually was born of an upper-level low that sat nearly stationary for over a week and gradually built down to the surface and acquired tropical characteristics.  Evidence of the upper-level low extends back to beyond September 20!  In this figure, there are slices of infrared satellite images shown every 12 hours for a week, and you can spot the same feature at nearly the same location east of the Bahamas the entire time.

It is in an area with minimal steering flow, so it is not forecast to move much in the next couple of days.  By Thursday, it should begin to feel a trough approaching the area and start to turn to the north.  However, there is tremendous spread among the reliable models even in the near future (1-3 days), so the timing is quite uncertain.  But, aside from the timing, there is decent agreement a general track to the north and then toward the northeast U.S. coast.

Track forecasts from a variety of global and regional dynamical models and consensus from the 06Z guidance. (UWM)
The intensity forecasts, for the most part, indicate that Joaquin will become a Category 1-2 hurricane around Friday.  Some models are significantly stronger, and few are weaker (AVNI and NVGI are global models, and have a harder time with intensity because of their coarser resolution).

Intensity forecasts from a variety of global and regional dynamical models, statistical-dynamical models, and consensus from the 06Z guidance. (UWM)
The official forecast from the National Hurricane Center is shown here, which generally agrees with the model consensus for track, but is a bit lower than the model consensus for intensity.


Vertical wind shear will be fairly strong over Joaquin until Thursday or so, which will be a key day to see if it intensifies quickly or not... because once it starts interacting with the trough that is expected to come off the east coast, the shear will increase again. 

However, and this is really important, if it begins to lose tropical characteristics as it heads north, that does not make it less dangerous should it make landfall.  A Sandy-like scenario is not something I'd predict this far out, but it's also not completely impossible and is something to be aware of.  There are a lot of unknowns to be resolved before being too concerned about that possibility.


23 September 2015

Okay, so I'm a geek.

This is an atypical and hopefully entertaining post... after being asked by several people about a particular "honor" bestowed upon me recently, I figured I might as well share.
The Weather Channel has a television program (it airs Sundays at noon eastern) called Wx Geeks.  For each episode, they select a "Geek of the Week", which is just a fun thing they do.  Well, lo and behold, I was that person this week.

The blurb that was on tv is available at https://www.youtube.com/watch?v=s_a49kYeAZY

You can also view the whole interview with photos on Facebook at https://www.facebook.com/WXGeeksTWC/posts/814677201979434

So there you have it!
-Brian


21 September 2015

Ida strengthens in central Atlantic

Since my last update on Wednesday the 16th, Tropical Depression 9 dissipated on Saturday.  The wave behind it was upgraded to Tropical Depression 10 on Friday morning, and later upgraded to Tropical Storm Ida on Friday night.  Ida is the season's ninth named storm.  Using 1981-2010 as the climatology, the ninth named storm forms on September 29 during an average season.


Ida has not done much though, as it turned to the northwest and encountered strong vertical shear. However, environmental conditions have been improving and Ida has strengthened as a result.  As of Monday morning, peak winds are estimated at 50mph.  It is forecast to remain nearly stationary but also to gradually intensify over the next five days. While it does stand a chance of becoming the season's third hurricane, it is not a threat to land.


Elsewhere, no new formation is expected this week.  But global models are in agreement on something brewing in the southern Gulf of Mexico this weekend, and generally tracking it northward.  This is absolutely not a cause for concern, it is just something to monitor in the models for now... the disturbance doesn't even exist yet.  Below is output from three global models (ECMWF, GFS, and CMC), all valid on Sunday evening.  The colored field is the 850mb vorticity, which is a measure of the curvature of the low-level wind.

850mb vorticity from the 00Z runs today, valid in seven days.  ECMWF is on the left, GFS is in the middle, and CMC is on the right. (tropicaltidbits.com)

16 September 2015

Tropical Depression 9 forms in central Atlantic

As I described in Monday's update, the easterly wave that was near 38°W was just upgraded to Tropical Depression 9.  It was a bit slow to get organized, but it did track northwest as expected.  It's currently centered about 1200 miles east of the Lesser Antilles and moving north-northwest at 8 mph.


It is entering a more hostile environment, so it may not be around long, and it won't get near any land or islands. If it should manage to sneak up to tropical storm intensity, the next name is Ida.


And, same as on Monday, there is a potent easterly wave right behind it which could become TD10 (or the next name after Ida is Joaquin) this week too.


This disturbance is also forecast to recurve by 45°W, and perhaps strengthen slightly in the coming days.


14 September 2015

Disturbance in central Atlantic expected to become TS Ida


An easterly wave that exited the African coast last Thursday has gotten slightly better organized and could become Tropical Depression 9 later today or tomorrow.  It is currently centered about 1400 miles east of the Windward Islands and is moving toward the northwest.  If it eventually becomes a tropical storm, the next name on the list is Ida.  However, as of Monday morning, it is decidedly not an impressive feature on satellite images... it's a tiny swirl with minimal thunderstorm activity.  In fact, it's hard to find unless you know where to look!  In the satellite image below, I drew an arrow pointing down to the feature of interest.


Model guidance predicts that this disturbance will become a tropical storm within the next 1-2 days, and turn to the north by the time it reaches around 45°W, keeping it far away from any land.

Further east, another easterly wave has just exited the African coast and models strongly favor its development as well.  Like the one to its west, this would also very likely recurve to the north long before reaching any land areas.  But, if it also develops into a tropical storm, the name after Ida is Joaquin.


10 September 2015

After Further Review: Tropical Storm Erika

A second post today, but this one is actually a look back at Erika.  Erika presented the media and forecasters with challenges, but none that were unexpected.  If you live in Florida, or any hurricane-prone coastal area for that matter, this National Hurricane Center blog post is a must-read.  Understanding forecast uncertainty is critical, and unfortunately, you won't typically hear about it on the news.

After Further Review: Tropical Storm Erika


Tropical Storm Henri forms near Bermuda at typical peak of Atlantic hurricane season

Today's update is available on the Washington Post's Capital Weather Gang blog:


Tropical Storm Henri forms near Bermuda at typical peak of Atlantic hurricane season


06 September 2015

Fred and Grace spinning in far eastern Atlantic

On Saturday afternoon, Fred was downgraded to a Depression, again.  As of Sunday morning, it remains a Depression, but is forecast to regain tropical storm status by Tuesday as it moves toward a more favorable environment.


It has been a tropical cyclone for almost 8 days, and apparently, the normal environmental thresholds for TC maintenance don't apply to Fred, so it could be around for quite a while longer!  It has begun recurving to the north, and is forecast to head toward the northeast over the next 5 days.


As I hinted at in Friday's update, Grace is indeed now an active storm.  An easterly wave that left the African coast on Thursday became Tropical Depression 7 on Saturday morning, and then was quickly upgraded to Tropical Storm Grace on Saturday afternoon.  Grace is the 7th named storm of the 2015 season, and climatologically, the 7th named storm forms on September 12.  However, in terms of ACE (Accumulated Cyclone Energy), the season is still only at about 55% of average for this date.

Large-scale visible satellite image of Grace from 9:15am EDT today.  The Cape Verde islands are to its northeast. The milky color to the west and north of the storm is indicative of dusty, dry, stable air from the Sahara. (NRLMRY)
Grace is on a strengthening trend, and is tracking west at 13 mph.  For reference, it is located about 1200 miles southeast of Fred.  Models generally agree that it will reach the Leeward Islands region in about 6 days (Saturday-ish).  Here I show a selection of global and regional dynamical model 5-day forecast tracks, as well as the NHC forecast (OFCI).


However, it will be slamming into a wall of strong vertical wind shear on Wednesday, which should quickly put an end to any intensification that may occur in the meantime.  Models are currently in unanimous agreement on this.  The map below shows the forecast wind shear valid late Wednesday night.... Grace is the 1008mb Low that you see just east of the Lesser Antilles, nestled right up into the subtropical jet.  Typically, wind shear over 20kts is detrimental to tropical cyclones, so the 40kt+ swath cutting through the tropics would certainly have an impact on it.


04 September 2015

Fred STILL not dead, and future Grace brewing in eastern Atlantic?

Much to the surprise of forecasters, Fred remains a minimal tropical storm on Friday morning, being sustained by intermittent bursts of strong thunderstorms near the center.  It's barely clinging to tropical cyclone status amidst very strong wind shear, dry air, and marginal ocean temperatures. The forecast continues to indicate Fred dissipating to a remnant low, but we shall see.  Several models actually indicate that it could re-strengthen in about 4-5 days as it turns toward the Azores, so we could still be talking about Fred at this time next week!

Visible satellite view of Tropical Storm Fred from 7:45am EDT today.
5-day forecast track of Fred, or whatever is left of it, from the 5am EDT advisory. (NOAA)

Elsewhere, an easterly wave that exited the African coast yesterday is showing signs of development.  It is currently centered about 350 miles southeast of the Cape Verde Islands, and about 2800 miles east of the Windward Islands.


It is likely going to track toward the west-northwest over the next 5 days as it gradually organizes.  It could become Tropical Depression 7, and then the next name on the list is Grace.  Just for reference (this isn't a forecast), the average easterly wave travel time from this location to the Lesser Antilles is roughly seven days.


02 September 2015

Fred weakening, and 80th anniversary of Labor Day Hurricane

Since my last update on Monday morning, Fred has weakened to a 45mph tropical storm and is quickly on the way to becoming a remnant low.  The Big 3 environmental factors for tropical cyclone intensity (sea surface temperature, wind shear, and low-level humidity) are all plunging into ranges that have caused Fred to quickly dissipate.  All that remains is a low-level swirl northwest of the Cape Verde Islands.  Although it was a short lifetime, it was the easternmost Cape Verde hurricane on record, which is certainly noteworthy.


Elsewhere across the Atlantic, there is nothing brewing in the foreseeable future.  This is a bit unusual as we ramp up to the climatological peak of the season!

Daily climatology of Accumulated Cyclone Energy (ACE).
Tonight is a very special anniversary... 80 years ago on the night of September 2, the most intense Atlantic landfalling hurricane on record hit the upper Florida Keys (Long Key): the infamous 1935 Labor Day Hurricane.  It made landfall with sustained winds of 185 mph and produced an 18-foot storm surge in the upper Keys.  It's worth pointing out that it was a tropical storm just 44 hours prior, so yes, tropical cyclones are capable of incredible intensification rates when conditions are ideal.  Even in 2015, I can say with confidence that we could not predict this super-rapid intensification.

Track of the 1935 "Labor Day" hurricane, which remains the most intense landfalling hurricane anywhere in the Atlantic.
If you use Facebook, my friend and hurricane historian Michael Laca has an excellent collection of photos and information from the storm: https://www.facebook.com/media/set/?set=a.220683491357229.52229.218869288205316&type=3&pnref=story

There's a beautiful memorial in Islamorada (which was completely obliterated that night) to commemorate the approximately 400 people who died in the storm... here is a photo taken by Michael.  The plaque at the base of the monument reads: "Dedicated to the memory of the civilians and war veterans whose lives were lost in the hurricane of September Second, 1935."

The 1935 hurricane memorial in Islamorada, FL.  Photo by Michael Laca.