31 July 2014

One more day of dry air for tropical disturbance?

Tropical Depression 3 has still not formed, though the easterly wave we've been watching since it left the African coast last Friday remains a close contender.  It has a closed surface circulation, but the thunderstorm activity associated with it has been marginal (not always centralized, and not always persistent).  It's now centered about 650 miles east of Trinidad, or 1100 miles east-southeast of Puerto Rico.

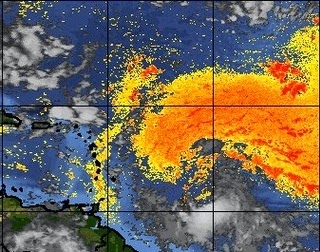
Visible satellite image from 7:45am EDT.  The limited thunderstorm activity is displaced to the south and southeast of the exposed surface circulation.
One thing that human forecasters and computer models admittedly have a hard time evaluating is dry air and how much it will impact a developing system.  The majority of necessary factors for development have been reasonably hospitable over the last few days, but it has been tracking along the south edge of some very dry air.  If the circulation were isolated and self-contained throughout the depth of the vortex, that dry air would not play a big role and the storm would probably already be a hurricane.  But, if there's a route for that dry air to get entrained into the circulation, development is choked off and the result is what we've seen this week so far.

Here's an image that shows infrared satellite data in grays, and the strength of the Saharan Air Layer (SAL) in yellows-reds.  Once the disturbance gets out closer to the Lesser Antilles, the SAL is barely present, and the environment is more moist.  Using an average speed of 5°/day, the wave should be moving out of the dry air by Friday morning.
Infrared image with Saharan Air Layer data overlaid. (CIMSS)
Models continue to forecast intensification, which they've been doing all along and have all been wrong (model agreement and confidence does not always translate to the real world!!).  But, if the dry air becomes less of a factor soon, it *should* finally develop.  This morning's track forecasts look similar to what we've been seeing, just a delayed northward turn. Be aware that at the later times in this forecast, the storm could actually be a hurricane (small probability, but not impossible).

Track forecasts from 3 global and 3 regional models (06Z runs).  For reference, 120 hours from this run would be valid early Tuesday morning. (B.Tang at UAlbany.)
Yesterday, I included a comparison of tracks for storms that passed within 100 miles of the wave's location during July/August and September/October.  The historical July/August tracks were very few and very weak.  Using this morning's position, and the same 100 mile buffer and the same July/August period, the historical map looks VERY different.  Now it includes 16 tracks, 5 of which became major hurricanes.  Several even turned north toward the Bahamas like this one is still expected to do.
Tracks of all tropical cyclones that passed within 100 miles of where the easterly wave is centered today during July and August (1851-2013).  The Cat3+ ones that turned toward the north are David 1979, Betsy 1965, and Unnamed 1893.

28 July 2014

Tropical depression may be forming in eastern Atlantic

An easterly wave that exited the African coast on July 25 is now located about 1900 miles east of the Windward Islands and moving west at 12mph.  Unlike the last contender, the environment ahead of this one will be more favorable for development.

Visible satellite image from 7:45am EDT.
It will continue tracking to the west over the next 5 days, and be approaching the Leeward Islands on Saturday.  It's too soon to say anything specific about the intensity, but it is expected to become a Tropical Depression and then a Tropical Storm within the next few days.  Once it's an established tropical cyclone, models will have a better grasp on its forecast.

This disturbance is far enough south that the bulk of the Saharan Air Layer (mid-level, dry, dusty air that flows from Africa and sometimes all the way across to Cuba, Florida, and Central America) is located to its north.  The SAL is currently weak over the Lesser Antilles.

Depiction of the SAL today... the dustier areas are darker red, while areas not affected by the SAL are blue. The easterly wave of interest is in the lower-middle part of the image. (CIMSS and NOAA)
As I mentioned last week, this is about the time we start paying closer attention to the far eastern Atlantic for hurricane embryos.  Most hurricanes, and especially major hurricanes, have their origins as African easterly waves.  This period begins in late July and typically lasts through mid-October.

An example of a very intense hurricane that began as an easterly wave in late July and became a tropical depression almost exactly where this disturbance is located now is Allen (1980).  In the track map below, Hurricane Allen is plotted.  The gray circle in the far lower right corner is where the current disturbance is located today.  Hurricane Allen became a Category 5 storm three separate times (for a total of 72 hours), peaking with sustained winds of 190mph, and is still the strongest hurricane on record in the Atlantic.

Track and intensity of Hurricane Allen (1980).  The current easterly wave of interest is located at the gray circle. (NOAA)

22 July 2014

Tropical Depression 2 fighting a losing battle

The tropical disturbance I wrote about yesterday is now Tropical Depression 2... my update today can be found on the Washington Post's Capital Weather Gang blog:

Tropical Depression Two fighting a losing battle


21 July 2014

Disturbance in central Atlantic a sign that Africa is waking up?

We are getting into the point of Atlantic hurricane season when we start to shift our attention far eastward to look for hurricane embryos.  From early August through mid October, many of the tropical cyclones that form can be traced back to easterly waves that are created over continental Africa.

Today, an easterly wave is located about 1300 miles east of the Lesser Antilles and has slowly been getting better organized since exiting the African coast last Thursday.


While the disturbance currently looks like it is on its way to becoming a bona-fide tropical cyclone, the environment in which it's embedded is far from hospitable.  The low-level air nearby is dry and dusty, courtesy of a huge plume of African air called the Saharan Air Layer... it's fairly normal to have this plume spanning the deep tropics this time of year.

Today's analysis of aerosols in the atmosphere.  While there are a variety of naturally-occurring aerosols,  the ones of interest here are dust particles from the Sahara Desert. The disturbance's approximate locatation is marked with a red dot. (NRLMRY)
Another factor working against it is dry air in the middle and upper parts of the atmosphere, as seen in this water vapor image.

Water vapor image showing dry air in browns and moister air in grays and brighter colors.  The disturbance is positioned in the lower right.  (NOAA)
However, for the next couple of days, the vertical wind shear is expected to remain relatively low, and the sea surface temperature under it is marginally high enough to sustain a tropical cyclone.  So it does stand a chance of forming if it does so soon.

If it should eventually reach tropical storm status, the next name on the list is Bertha.  Bertha is still one of the original names from the set of six lists started in 1979.  It was first used in 1984, so this year will be its sixth time around.  This is a total coincidence, but Bertha 1996 was also located very close to where this system is now, and it ended up becoming a Category 3 hurricane north of Hispaniola and making landfall on North Carolina as a Category 2 storm on July 12.

Hurricane Bertha in July 1996.  The gray circle in the lower right shows where the current disturbance is located.  (NOAA)


04 July 2014

Arthur was strongest U.S. landfall in six years

At 9pm EDT last night, Arthur was upgraded to a Category 2 hurricane, the first since Sandy in 2012.  Then shortly after 11pm EDT last night,  it made landfall on Cape Lookout, NC with 100mph winds and a 976mb central pressure.  It was the strongest landfalling hurricane on the U.S. since Ike in 2008.  It was also the earliest North Carolina hurricane landfall on record.  And as I've mentioned before, the last three seasons with a hurricane formation so early in the season were 2012, 2010, and 1995; all extremely active years (may just be a coincidence, but interesting nonetheless!).

Category 2 Hurricane Arthur at landfall on Cape Lookout.  Image is from 10:58pm EDT on July 3.  Landfall is defined as the center crossing the coastline.  (College of DuPage)
As of this morning at 8am EDT, the storm has maintained intensity and maximum sustained winds remain 100mph and the pressure has fallen to 973mb.  As of this writing, it is centered 100 miles due east of Virginia Beach and moving northeast at 23mph.

Visible satellite image from 8:30am EDT on July 4. (NASA)
Little has changed with the forecast... it will pass by the northeast coast today, making a close encounter with Cape Cod late tonight as a Category 1 hurricane followed by a second landfall on Nova Scotia on Saturday morning as it transitions to an extratropical cyclone.  See the NHC website for the latest track forecast as well as watches and warnings.

Eastern MA and eastern ME can expect heavy rain and tropical storm force winds as Arthur passes by, and coastal areas will experience heavier surf but storm surge should not be a big problem.

Finally, I wanted to share some buoy and C-MAN station observations that experienced near-direct hits on Thursday night by Arthur.  These plots show five days of observations of surface wind speed (blue) and wind gust (red) as well as surface pressure (green). All of the locations were inside the eye, though not perfectly in the center.

Buoy 40136: Onslow Bay Outer

Station BFTN7: Beaufort

C-MAN CLKN7: Cape Lookout