 Elsa ended up making landfall just north of Steinhatchee in Florida's Big Bend area as a strong tropical storm on Wednesday morning, after briefly regaining hurricane status west of Tampa.
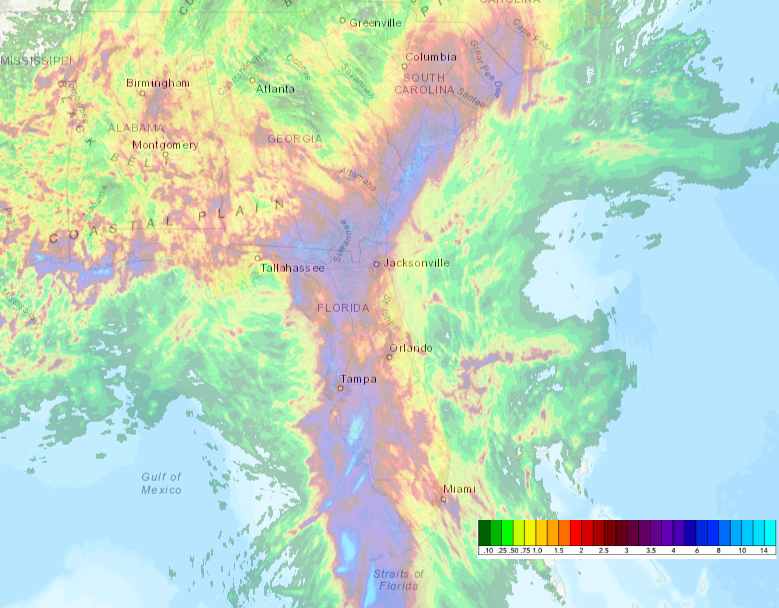
The heavy rainfall has been the biggest concern, and will continue to be as it passes through the Carolinas and off the mid-Atlantic coast over the next couple of days. The first map below shows the observed rainfall over the past three days (since Monday morning). The swath of highest totals includes the west coast of the Florida peninsula, then up into coastal Georgia and South Carolina.
And next is the outlook for flash flood risk over the next three days:

But this post's primary purpose is to highlight just how rare of an event we just witnessed. In the scope of a full hurricane season, a storm like Elsa is not rare at all, but for early July, it is absolutely extraordinary. The official database of Atlantic tropical cyclones goes back to 1851, or 170 years. We've only had the benefit of routine weather satellite coverage for the past 50 years or so, but prior to that, we had aircraft surveillance, and prior to that, we had lots of ship traffic and land-based observations.
Elsa traveled through the eastern Caribbean Sea as a hurricane in early July. The only other years to have that happen were 1933 and 2005, literally the two most active hurricane seasons on record. It's quite unlikely that hurricanes were missed in or near the Lesser Antilles even 170 years ago. In other words, I think that is a robust record and a very rare event. Such an event becomes far more common later in the season, but climatologically, we just don't get the strong African easterly waves yet, or favorable environmental conditions to allow their development.

There's also a more fuzzy record that Elsa set: the earliest 5th named storm on record. That record was just set last year on July 6th, 2020, and then broken again on July 1st, 2021. This record also applies to the full 170-year database, but I call it fuzzy because it's certainly possible that small, remote, weak, and/or short-lived storms were missed prior to the satellite era, or even prior to the past couple decades with better observing technology.
Finally, through July 8, the Accumulated Cyclone Energy (ACE) is an incredible 375% of the average over the past fifty years. In the past 170 years, it's the 12th highest value by this date, and in the past 50 years, it's the 2nd highest (2005 is 1st).
This chart below includes the annual totals of ACE since 1851 (orange bars), and the ACE totals only through July 8th (purple bars). I plotted them on a logarithmic axis so we can actually see the little values along with the big values, and I highlighted and labeled the 11 years that had higher ACE as of July 8. Not every year with an active beginning ended up being hyper-active, but some of the most hyper-active seasons had active beginnings.

There are currently no other areas of concern, but when the time comes, the next name on the list is Fred.
Wow, such an amazing post.
ReplyDelete