17 June 2026

Tropical Storm Arthur forms on Texas coast


The first named storm of the 2026 Atlantic hurricane season, Arthur, has formed and is centered just southwest of Galveston. The maximum sustained winds are 40 mph and it's crawling toward the northeast at 9 mph. Although it will dissipate soon once it's back over land, the flooding rainfall threat will exist for the next several days across the southeast U.S.


As is evident in the satellite image at the top of the post, the strong thunderstorm activity is all displaced to the south and east of the low-level center, so the heavy rainfall threat is already over for Texas, but a lot lies ahead for Louisiana and areas to the east... all the way into Georgia this weekend.


Over the past five decades, the median date of first named storm formation is June 18, so this is right on schedule. And although the trend is toward earlier in the year, the past five years are all above that trend line (later).
Although there's nothing else on the horizon now, the next couple of names on this year's list are Barry and Chantal.  Arthur, by the way, has been on the rotating list of names since it was first introduced in 1984, so this is its 8th time around (1984, 1990, 1996, ..., 2026).


16 June 2026

First named storm of the season could be brewing in the Gulf of Mexico

This is now my 31st year writing these updates on tropical Atlantic activity.  During that time, I have written approximately 1470 posts spanning 488 tropical cyclones including 228 hurricanes, 107 major hurricanes, and 57 retired storm names. 

I began writing these posts in the summer of 1996 (prior to starting my junior year of college), and the internet and data availability looked very different then. We were still at least a decade away from social media. I was honored to be asked to write blog posts for the New York Times from 2007-2010 and then the Washington Post's Capital Weather Gang from 2012-2019.

I plan to continue this blog into 2026, but that also seems like a good milestone to wrap it up. I know some of you reading this have been following along the entire time, but whether you've been reading these posts for 1 year or 30 years, I truly appreciate your interest!

Now, on to the tropics. Over the past week or so, a poorly-organized disturbance has been festering over Central America, then crossed the Yucatan Peninsula, then oozed across the Bay of Campeche, and is now located inland over southern Texas.


It has been tagged as Potential Tropical Cyclone One, which is a fancy way of saying it's still just an area of interest, but could develop soon and tropical storm watches and warnings have been issued for parts of coastal Texas and Louisiana. If it becomes a subtropical or tropical storm, the first name on this year's list is Arthur.


Although it will only have a brief window to exist as a tropical cyclone over water on Wednesday, the primary threat from this system is not wind, it's water. Extended periods of heavy rain from Texas into Georgia and surrounding areas will result in widespread flooding through the rest of this week.


If this does became a named storm, 2026 will be the fifth consecutive year with the first named storm forming in June... prior to that the first named storm formed before June 1 for seven consecutive years.

I'll take the rest of this post to look at a bigger picture.  A much-anticipated El Niño has just begun, and model forecasts indicate it will become a strong one in the coming months. In general, that will act to suppress Atlantic hurricane activity, especially in the deep tropics where its influence on vertical wind shear is the greatest.

Unlike in 2023 when there was an El Niño and record-warm water temperatures across the Atlantic producing competing nudges on hurricane season, this season is beginning with near-to-below-average water temperatures across the deep tropical Atlantic as we look ahead to a very strong El Niño.

https://bmcnoldy.earth.miami.edu/tropics/sectors/

As such, the seasonal outlooks are generally indicating below-average activity this season. The average season has 14 named storms, 7 hurricanes, and 3 major hurricanes, so a slightly below-average season could still have 11 named storms, 5 hurricanes, and 2 major hurricanes (from the Colorado State University forecast released on June 10).  It is just as important to stay vigilant and prepare for hurricane season this year as in any other year.


If you missed my first two posts earlier this year, they are available here...


16 March 2026

2026 "Cone of Uncertainty" Update & Refresher

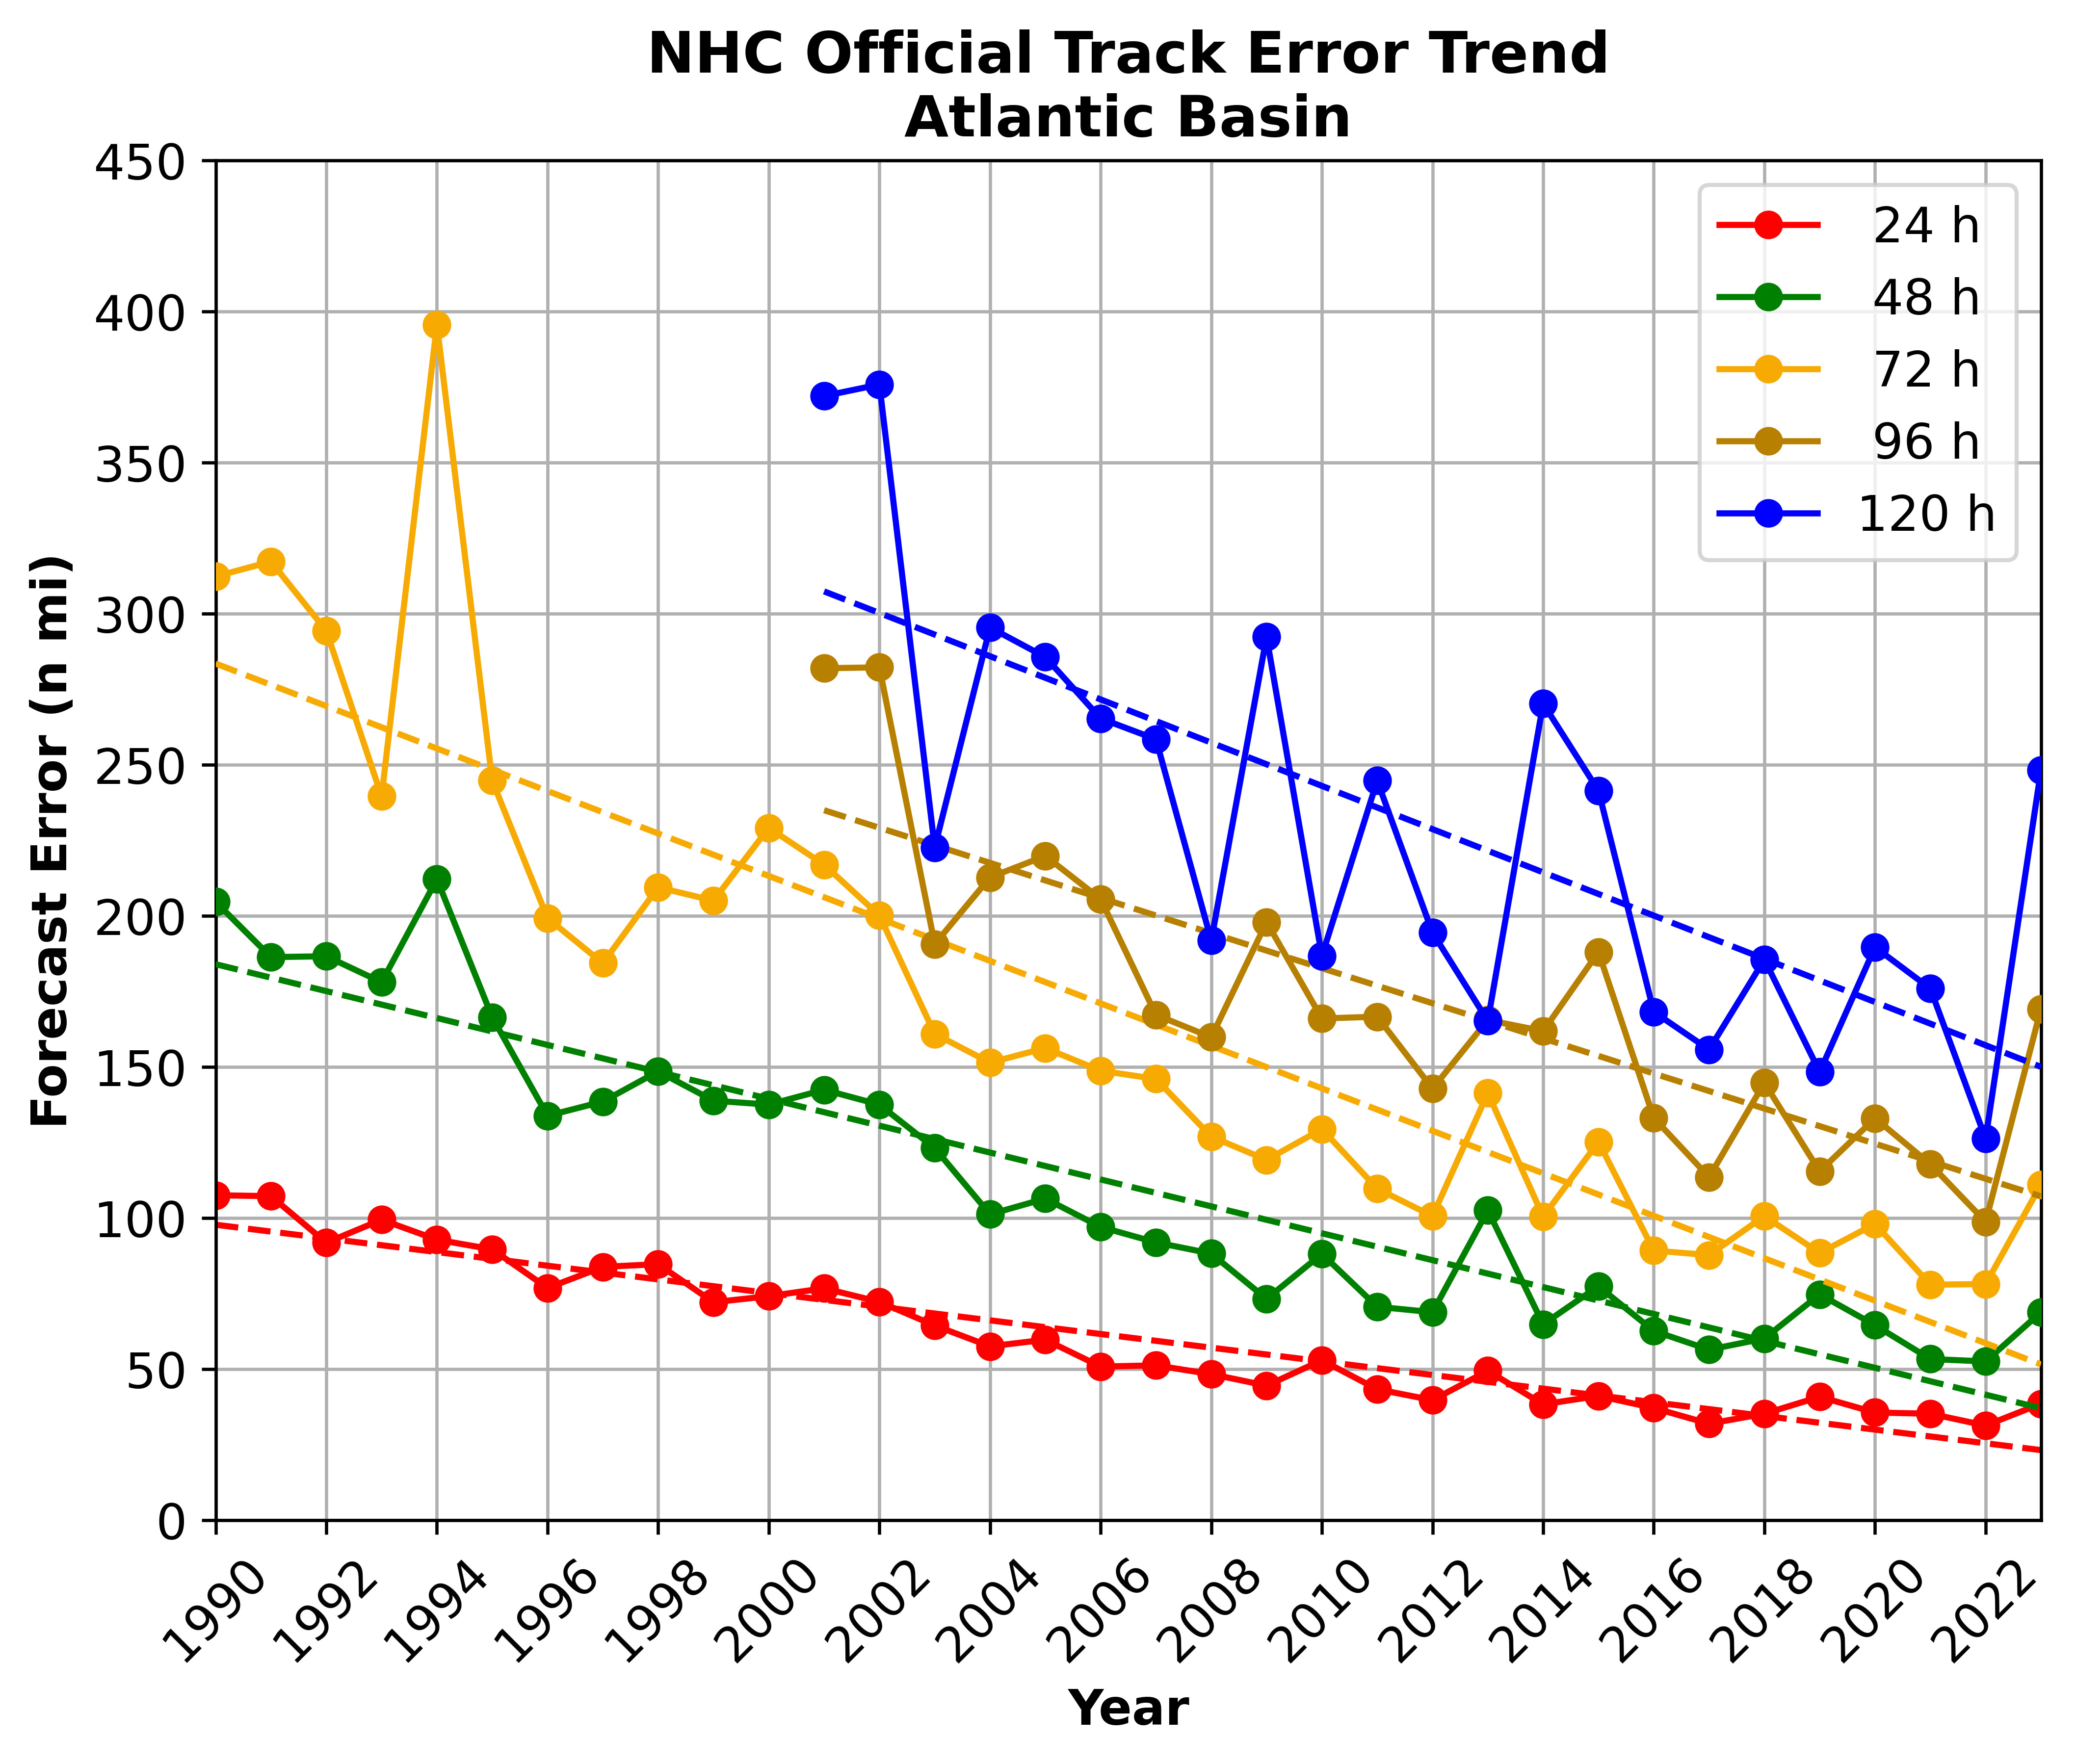
Anyone who lives on or near a hurricane-prone coast is undoubtedly familiar with the track forecast cone or "cone of uncertainty" which has been produced by the National Hurricane Center since 2002.  It begins as a point at the current position of a tropical cyclone and expands to show the potential position of the storm's center in the next five days. It is often called the "cone of uncertainty" because the further out in time you go, the more uncertain the forecast becomes... and it tends to look like a cone!
(By the way, "tropical cyclone" is a blanket term that refers to tropical depressions, tropical storms, and hurricanes.)

A "cone of uncertainty" for Hurricane Irma (left) and Hurricane Harvey (right). Both cones are from 2017 and are therefore identical to each other in their construction. 

The size of the cone is fixed for every forecast of every storm during an entire hurricane season, but the size slowly evolves from year to year. If the storm is moving quickly, the cone will appear more elongated and if the storm is moving slowly, the cone will appear more compact... but it's the exact same cone.  The examples shown above are from Irma (left) and Harvey (right); both storms occurred in 2017, so both cones are identical in their construction.

The cone is updated each year prior to the start of hurricane season, and it usually shrinks each year.  Overall, hurricane track forecasts are gradually improving, meaning that in general, there is less uncertainty where a storm will track now than there was a couple decades ago.

The map below shows a sample satellite image with the new 2026 cone overlaid on the 2015 and 2004 cones for comparison.  In 2026, the cone is the smallest it has ever been at days 2-4 and then tied for the smallest at 1 and 5 days! The largest improvement over last year's cone is at the 2-day lead time, with a 7.4% reduction in size.


So just how is the size updated each year?  The National Hurricane Center uses its own track forecast errors over the previous five years to calculate a circle at each "lead time" (1 day, 2 days, ... 5 days).  The size of that circle is designed to enclose the position of the storm's center with 2/3 probability, meaning that there's historically a 1/3 chance the storm will track outside the circle at that time.  Lines connecting the various circles complete the shape of the cone. [Note that the 2026 cone size is thus determined from track errors during the 2021-2025 seasons.]

This next chart shows the evolution of the cone's size at each forecast day -- it's clear that progress is slowing and perhaps has reached a limit at some forecast lead times.


Improvements are getting increasingly challenging to achieve because there can never be a perfect forecast of a chaotic system like the atmosphere. We call this a "limit of predictability", and there will come a time when we reach it and meaningful improvements can no longer be made.  Some would argue we are very close to that limit.  It's critical to understand that forecasts evolve and there is always some amount of uncertainty in them.

Since the cone is so widely used yet sometimes misunderstood, here are some key refreshers:
  • The cone does not tell you anything about where impacts will be experienced.  It is NOT a "cone of concern"! Even for a perfect down-the-middle track forecast, impacts such as strong wind, heavy rain, storm surge, and tornadoes will extend beyond the cone. Cone graphics on the NHC website include some of the relevant watches and warnings, as shown in the examples at the top of the post.  Given its positive reception during the past couple of years, tropical storm and hurricane watches and warnings will be displayed inland too, not just on the coast (see this example from Milton 2024). 
  • The cone does not tell you anything about the size of the storm.  Regardless of how strong they are, hurricanes come in a wide range of sizes.  Back in 2017, NHC added the latest observed size of the wind field to its cone graphics to help illustrate this (see the Irma and Harvey examples above... the orange and red shading indicates the extent of tropical storm and hurricane-force winds at the time the forecast was issued).
  • The cone does not tell you anything about the actual uncertainty associated with the forecast. Since the size of the cone is fixed, it cannot become more narrow or broad to accommodate a more or less predictable environment.
  • Nothing magically happens at the edge of the cone. If a hurricane is approaching and you are scrutinizing each new forecast to see if you are inside the cone or not, you are missing the point of it.  It is arbitrarily chosen to be the 67% historical probability threshold... a 75% probability cone would be larger, and a 50% probability cone would be smaller.  Again, it is NOT a "cone of concern"... there is no such thing.
  • If you use the cone graphics from NHC, there is some information about intensity provided. At each forecast point, there is a letter written inside the black dot corresponding to a general intensity range: D (tropical depression), S (tropical storm), H (hurricane (Category 1-2)), and M (major hurricane (Category 3+)).  But keep in mind that there is uncertainty associated with the intensity forecasts too!
So, let's imagine what a cone of uncertainty for intensity might look like. Consider this: averaged over the past five years (2021-2025), the mean error in a 1-day forecast is +/- 8.3 mph, the error in a 3-day forecast is +/- 13.7 mph, and the error in a 5-day forecast is +/- 18.2 mph.  But there is also a wide range of values that go into those averages, meaning that there is a small probability of a very large error and a small probability of very small error.

To create the next figure, I simply averaged five years of intensity errors together such that the values listed for 2026 are based on the NHC's intensity errors during the 2021-2025 seasons (and 2025 used 2020-2024, and so on).  This five-year averaging helps to mimic the smooth trends of the track forecast cone, but it is not a 2/3 probability like the track cone. Although not quite as convincing as track, one could make the case that we are nearing the limit of predictability for intensity at several lead times too. 


Next, using a made-up five-day intensity forecast and the average error values for 2026, I created the following chart.  This is what an intensity forecast cone could look like; a hypothetical intensity forecast is shown with the red line and the "cone of uncertainty" is the light red shading surrounding the forecast.


04 March 2026

100th Storm Name Retired After 2025 Hurricane Season

During its annual meeting taking place this week in Mexico City, a hurricane committee within the World Meteorological Organization decided that just one name would be retired following the 2025 Atlantic hurricane season: Melissa.  Melissa is the 100th retired storm name in the Atlantic, and it will be replaced by Molly in the 2031 list.

So... how does this naming and retiring work??

Tropical cyclone tracks during the 2025 Atlantic hurricane season, color-coded by Saffir-Simpson category (TD=light blue, TS=dark blue, Cat1=light green, Cat2=dark green, Cat3=orange, Cat4=red, Cat5=maroon).  The track of Hurricane Melissa is highlighted with a thicker line.

The underlying reason for assigning names to tropical cyclones (TCs) is that it makes communicating information about these huge and impactful storms simpler than referring to them solely by numbers or even by their coordinates on the globe.  A tropical cyclone is given a name once the sustained winds reach 39 mph (63 kph)... a tropical storm.

Tropical storms and hurricanes in the Atlantic Ocean started receiving human-sounding names 73 years ago.  After a few years of trying the World War 2-era Phonetic alphabet for storm names, the 1953 list featured all-female "human" names: Alice, Barbara, Carol, Dolly, Edna, etc.

That remained the practice (with a few modifications to the lists in 1955, 1960, and 1971) until 1979 when the modern naming system was introduced in which six lists of alternating male/female names are reused every six years.  In other words, the list of names from 1979 was reused in 1985, 1991, 1997, and will be used again in 2027.  That is why the 2025 list will next be used in 2031.  Those six lists only contain 21 names, as it was felt that there were not enough common names that begin with Q, U, X, Y, or Z to be sustainable.
Trivia 
Q: What was the first "male" name assigned to an Atlantic tropical cyclone?
A: It was Bob on July 10, 1979.
It did not take long to realize that some storms' names were particularly infamous and traumatic because of the death and destruction they caused, and it became the practice to retire those names and replace them with a different name of the same gender and letter (for example, Andrew was replaced by Alex and Irma was replaced by Idalia).

In 1954, three terrible hurricanes put this concept into practice: Carol, Edna, and Hazel.  Since then, and including 2025, there have been 100 names retired.  Since 1979, the names and retirees have been chosen by a committee within the World Meteorological Organization.  The committee is comprised of representatives from 28 member nations that are affected by Atlantic hurricanes, so names tend to reflect a broad range of nationalities.  
Trivia 
Q: What names were retired upon their very first use in the modern naming era?
A: There have been nine, though four of them are from the initial use of the lists.  David (1979), Frederic (1979), Allen (1980), Alicia (1983), Michelle (2001), Ike (2008), Igor (2010), Irma (2017), and Milton (2024).
The process of retiring a name is surprisingly subjective; there are no minimum requirements for the number of fatalities or the economic losses to be met in order to be considered for retirement.  The country or countries affected simply nominate a storm name for retirement, make a case for it, and the committee votes.  It is tempting to construct some objective criteria, but consider the same hurricane hitting a rural stretch of the United States coastline versus passing over a small Caribbean island nation.  In the U.S., such a storm would likely not make a significant or lasting impact, but the small island could be devastated.

The following sequence of charts groups the retired names by various criteria.  The most retired letter is "I" (13 times) and it's not even close.  One might suspect that "I" storms tend to occur at the peak of the season when intense hurricanes are most common, but why wouldn't "H" and "J" be way up there too since they'd likely occur right around the same time?  Instead, "F" and "C" names are the most commonly retired after "I".  Historically (1953-2025), the "I" storm only forms on September 23. Climatology certainly plays some role in this distribution, but luck takes care of the rest. Melissa was the 8th "M" name to be retired.


There's a similar way to count this frequency: by storm number. A tropical cyclone only earns a name when it becomes a tropical or subtropical storm, so the first named storm isn't necessarily the first tropical (or subtropical) cyclone of the season. For example, Andrew was the 4th TC of the 1992 season; there was a subtropical storm in April and a couple tropical depressions in June and July. By modern convention, the subtropical storm in April would be named Andrew and the Category 5 hurricane in August would be Bonnie, but subtropical storms were not given names until 2002. And although K is the 11th letter of the alphabet, Katrina was the 12th TC of the 2005 season (and strangely, the only time the 12th TC was retired!). By this metric, the 9th tropical cyclone in a season is the most likely to get retired, followed by the 13th and then 11th. Those would align with I, M, and K if all TCs got named.


Since storms can affect multiple places over several days or even a week, it can sometimes be hard to assign a date to what event caused the storm name to be retired.  The next two charts simply assign the storm's month and Saffir-Simpson category based on when it achieved its peak intensity.  Not surprisingly, the peak month is September with nicely-distributed drop-offs in August and October.
Rather than showing raw counts, the second chart in this set shows the percentage of each category that ended up getting retired -- if there's a Category 5 hurricane lurking anywhere in the Atlantic, there's historically a 78% chance it will end up having its name retired!  Roughly 45% of all major hurricanes (Category 3-4-5) end up getting retired, and major hurricanes account for 86% of all retired names. (A "major hurricane" is conventionally defined to be one that reached Category 3+ intensity.)


The next chart shows how many names were retired each year.  The most was 5 (in 2005), and 21 of the 73 years had no names retired (most recently in 2023).  I also added a trend line, which is decidedly upward.  Since there has never been objective criteria for retirement, we can't logically blame that trend on evolving criteria.  One contributing factor could be that, on average, hurricanes are gradually getting stronger and wetter due to climate change.  But primarily, there are simply more people and there is more stuff in harm's way now compared to several decades ago, so the same hurricane is more likely to cause more problems today.


There is really no meaningful trend, up or down, in the number of fatalities caused by storms that end up getting retired, but the median number is 60 people (as few as 1 and as many as ~12,000)... I didn't include that chart in here, but if you're interested in seeing it, please ask.

In terms of inflation-adjusted economic incurred losses, there is definitely an upward trend.  The hurricane seasons of 2017 and 2005 dominate the data, but even without them the trend is upward.  The median value of economic losses caused by a retired storm is $7.6 billion 2026 USD (as low as $10m and as high as $208b). By the way, notice that the 4 retired storms in 2017 (Harvey, Irma, Maria, Nate) were more costly than the 5 retired storms in 2005 (Dennis, Katrina, Rita, Stan, Wilma).


Since the practice of retiring storm names is so subjective, the statistics presented here are not simply a reflection of what's happening in nature -- there is a significant human component to it.  And even the human component has components to it: 
  1. A storm can be less deadly if more people are able to evacuate or have a safe shelter
  2. A storm can be less costly if the coastline and construction are more resilient to hurricane hazards
  3. With no objective guidelines, a couple dozen people nominate and vote on which names get retired.  There are several examples of past hurricanes that probably should have had their names retired, but didn't.  Two extreme cases are Gordon (1994) which was responsible for nearly 1,200 deaths and Sally (2020) which caused $9.2 billion in damage (2026 USD). Both names are still in use.

Trivia 
Q: Were there any names retired in 2020, and if so, what will replace them in the 2026 list?
A: There were three: Laura, Eta, and Iota.  Laura will be replaced by Leah this coming season. But here's the tricky part: the 2020 season was so active that there were 9 storms beyond the regular name list, so it extended into using letters from the Greek alphabet for storm names. The committee voted that Eta and Iota from the Greek alphabet warranted retirement, but also that it didn't make sense to retire a letter (this scenario never arose before). So, the entire convention of using the Greek alphabet as a supplemental list was retired! Instead, there's an alphabetical list of names that could be retired and replaced as needed: