I have had the pleasure of knowing Phil for almost exactly 16 years now. We met at Colorado State University in Fort Collins, Colorado. I started graduate school there in 1998, then he came in 2000, and our mutual interests of hurricanes and hiking resulted in plenty of time to talk storms (while getting exercise!).
When it comes to tropical meteorology and seasonal prediction, Phil's enthusiasm is unparalleled. In December of 2005, after 22 years of authoring the well-known seasonal hurricane forecasts, Bill Gray handed over the lead authorship to Phil, who continues to expertly handle the outlooks and verification to this day. You can visit the CSU Tropical Meteorology Project at http://tropical.atmos.colostate.edu/, and follow Phil on Twitter: @philklotzbach
=====================================================================
At this point, just about everyone has heard that a strong El Niño is underway. El Niño is simply warmer-than-normal sea surface temperatures (SSTs) in the central and eastern tropical Pacific Ocean that occurs about every three to seven years, on average. This El Niño can be clearly seen by looking at a recently-updated map showing SST anomalies (departures from normal):

Current SST anomalies across the Pacific Ocean. (NOAA)
El Niño impacts more than just water temperatures at the surface. A series of buoys monitors temperature anomalies at various depths in the ocean as well, and their current analysis shows anomalously warm sub-surface water in the eastern tropical Pacific, with cooler-than-normal in the western tropical Pacific. This type of water temperature pattern is typical for robust El Niños.
What does an El Niño do to the large-scale atmosphere/ocean circulation? Basically, it shifts where deep thunderstorms typically form in the tropical Pacific (near Indonesia) closer to the International Date Line. This alters lower- and upper-level wind patterns as shown in the schematic below. These altered lower- and upper-level wind patterns are the primary reason why El Niño typically results in reduced Atlantic hurricane activity (more on this later).
 |
| Observed mean (top panel) and anomalous (bottom panel) temperatures in the top 500 meters of the ocean across the tropical Pacific. (NOAA) |
 |
| Schematic showing the typical atmospheric and oceanic response to El Niño events. (NOAA) |
How does this El Niño compare with prior events?
As we go back in time, there is more uncertainty in the data, but we can be relatively confident that observations are reliable since 1950. One region that is typically referenced to measure the intensity of El Niño events is the "Nino 3.4" region. This region is defined to be 5°S-5°N, 170°-120°W and its location, along with several other adjacent regions which are also monitored, are shown in the figure below:
At the end of June, the SST anomaly was +1.0°C in the Nino 3.4 region, which was the 2nd warmest June value since 1950, trailing only 1997. The 1997/1998 El Niño event is generally considered to be the strongest El Niño of the 20th century. While final July SST values will not be available for several more days, the Climate Prediction Center provides weekly values. Using these values as estimates for the monthly value for 2015, it appears that 2015 will remain slightly behind 1997 for the strongest El Niño since 1950 for July. While not quite up to the magnitude of 1997, this still qualifies 2015 as the 2nd strongest El Niño since 1950 for the month of July.
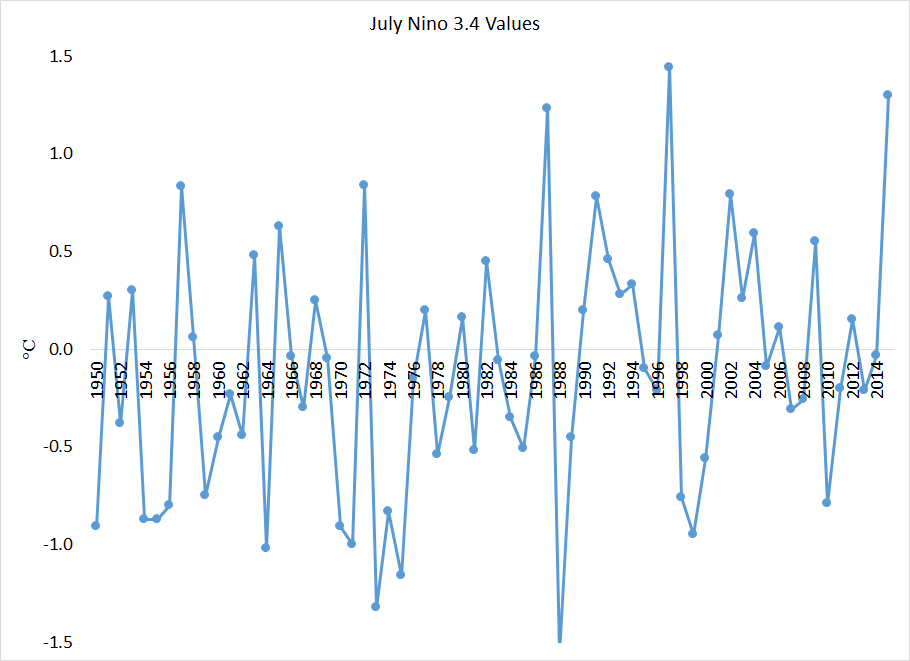 |
| July Nino 3.4 values from 1950-2015 as calculated from ERSSTv4 data. 2015's value is estimated from weekly SST data provided by the Climate Prediction Center. |
The latest forecast from the European Centre for Medium Range Weather Forecasts (ECMWF) indicates that this year's El Niño event is likely to eclipse the 1997 event by the end of the summer. The ECMWF, though very skillful, tends to be aggressive at developing El Niños, but any way you look at it, this year's event is going to be one of the strongest of the past 65 years.

Ensemble forecast from the ECMWF model for the Nino 3.4 region through January 2016. Each red dot represents one of fifty ensemble members. 1972, 1982 and 1997 are the third, second and strongest El Niños, respectively, since 1950.
How Does El Niño Affect the Atlantic Hurricane Season?
The remaining portion of this blog will briefly discuss the impact of El Niño on Atlantic basin hurricane activity. This relationship was first discovered by Dr. Bill Gray, founder of CSU's seasonal hurricane forecasts, and was first published in 1984. Increased upper-level westerly winds associated with El Niño increase vertical wind shear (the change in wind direction with height in the atmosphere) and tear apart hurricanes trying to form in the Atlantic. The figure below shows typical levels of vertical shear in the Atlantic Main Development Region (MDR) experienced in both El Niño and La Niña conditions (cooler than normal water in the eastern and tropical Pacific).
 | ||||
| Typical vertical wind shear patterns experienced in El Niño and La Niña conditions, respectively. |
 |
| Vertical wind shear anomalies in the Caribbean by year since 1979. Anomalies were calculated from the Climate Forecast System Reanalysis (CFSR) (through 2010) and the Climate Forecast System (CFS) version 2 analysis (2011-2015). |
 |
| Impact of El Niño, neutral (near-average tropical Pacific SSTs) and La Niña on Atlantic hurricane activity as measured by ACE by month. |
- Visit the Tropical Atlantic Headquarters.
- Subscribe to get these updates emailed to you.
- Follow me on Twitter