29 November 2021

An incredible sixth consecutive active hurricane season ends

This post marks the end of my 26th year writing these updates on tropical Atlantic activity.  During that time, I have written approximately 1350 posts spanning 444 tropical cyclones, 197 hurricanes, 92 major hurricanes, and 50 retired storm names. I was honored to have been invited to write for the New York Times' hurricane blog from 2007-2010, and then for the Washington Post's Capital Weather Gang since 2012.  I truly appreciate your continued interest!


The 2021 Atlantic hurricane season is the sixth consecutive season with above-average activity: there were 21 named storms, 7 of which became hurricanes, and 4 of those became major hurricanes (Category 3+).  The average values of those quantities are 14, 7, and 3.

2021 was only the third season to ever exhaust the regular list of 21 names... the other two times being 2005 and 2020.  It was also the seventh consecutive season with a named storm formation prior to the official start of hurricane season on June 1, helping to pull the trendline earlier when we look back on the past fifty years of first named storm formation date. 
Timeline of the date of first named storm formation over the past fifty years. The cyan line marks the official start of hurricane season, the magenta line is the median date of first storm formation, and the dashed gray line is the linear trend.  I do not count Hurricane Alex in January 2016 here since that was meteorologically a late addition to the 2015 season.

The Accumulated Cyclone Energy (ACE) was above-average all season long, and blew past a full average season's total on September 28th -- it ended up at about 141% of average (using 1971-2020 as the baseline climatology).  Rather than counting the number of storms, ACE is a metric that accounts for the overall intensity and duration of whatever storms there are.

The ACE was above 129 units for the sixth consecutive year -- this has never happened before, not during the satellite era, not since records begin in 1851. This sustained level of tropical cyclone activity in the Atlantic is unprecedented even for four years, let alone six!

Hurricane Larry and Hurricane Sam were the heavy hitters of the year by this measure... Larry contributed 33% of the season's total and Sam contributed 37% of the total. The storm in third place is way down at 7%, and that was Ida.  It is worth mentioning that 9 of the 21 named storms were only around for two days or less, and they contributed just 4% of the season's ACE, combined.


As you can see on the chart above, the burst of activity in late September came to an abrupt end on October 5th.  The lone straggler was Tropical Storm Wanda which was around from October 31st to November 7th, and formed from a former Nor'easter.  It's extremely rare and peculiar to have an active season essentially shut down in the first week of October!

Although still preliminary, the 2021 season is the 4th costliest Atlantic hurricane season, behind 2017 (1st), 2005 (2nd), and 2012 (3rd).  The economic losses are expected to exceed $70 billion, bumping the fresh-in-our-memory 2020 season down to 6th place.

Drilling down to individual storms, Ana formed prior to the official start of the season, on May 22, as referenced above.  Bill formed off the southeast U.S. coast and headed out over the open ocean. Claudette, Danny, Elsa, and Fred all made landfall on the U.S. mainland.

Grace was the season's first major hurricane, reaching Category 3 intensity right as it made landfall in Mexico near Veracruz.

Enhanced infrared satellite animation of Category 3 Hurricane Grace making landfall on August 21st.

Hurricane Henri was quite impactful in the northeast U.S. when it made landfall in New England on August 22nd as a tropical storm.  It caused widespread power outages and produced record-breaking rainfall in New York City and flash flooding across several states.  This same area would be impacted with more heavy rain by Ida in just over a week.

A full-resolution version is available at http://bmcnoldy.rsmas.miami.edu/tropics/radar/

The most intense of the landfalling storms was Hurricane Ida, which made landfall near New Orleans on August 29th, on the 16th anniversary of Hurricane Katrina's landfall in the same location.  It was a Category 4 hurricane, reaching peak intensity right as it made landfall.  Its strong winds and storm surge caused extensive catastrophic damage across southern Louisiana.

A full-resolution version is available at http://bmcnoldy.rsmas.miami.edu/tropics/radar/

As usual, Ida's trail of destruction didn't end at the coastline. Three days after landfall, post-tropical cyclone Ida interacted with a mid-latitude trough and a very focused band of extreme rainfall was the result.  Although the event was remarkably well-forecast days in advance, rainfall totals in PA, NJ, and NY and then into southern New England were incredible, devastating, and deadly.


Ida was responsible for 115 fatalities and over $65 billion in damages from Venezuela and Colombia, then Jamaica and Cuba, and finally the United States.  It's always tempting to "write off" a hurricane after landfall, but in fact, there are often several days of severe impacts remaining as it moves inland... quite far from where it made landfall.  Ida is tied with 2012's Sandy as the 4th costliest hurricane in U.S. history.

Moving ahead, Larry was a long-track major hurricane, and a named storm for 10.5 days.  It clipped Newfoundland at the end of its journey on September 11th, causing fairly significant damage, and rip currents associated with it killed two people in Florida and South Carolina.

Like Grace and Ida, Nicholas reached its peak intensity right at landfall -- near Galveston TX on September 14th as a Category 1 hurricane.

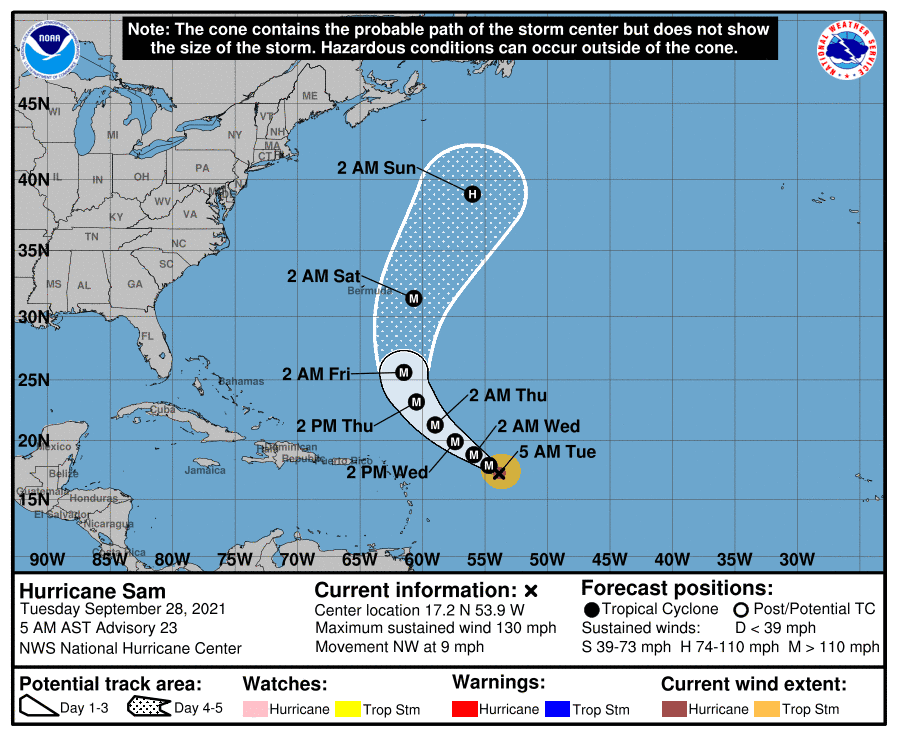
The strongest storm of the season was Sam, which fortunately remained over water in the central Atlantic. It was a named storm for 12 days, nearly 8 of which were spent above Category 3 intensity! It also produced the fifth most ACE of any Atlantic hurricane on record (https://twitter.com/BMcNoldy/status/1445428509220892673)! 

Hurricane Sam on September 26th, when it was just a click away from reaching Category 5 intensity.

Keep in mind that all statistics presented here are preliminary; the National Hurricane Center will have the final post-season reanalysis of all storms complete in a few months.  We will also find out which names will be retired early next year.  But we can reasonably anticipate that Ida will be retired, so I will offer these following updated charts with that in mind (and not knowing if any other names will be retired from this season).  Ida's all-but-certain retirement puts "I" storms even more in the lead, as well as retired storms that peaked at Category 4 intensity.  (The colors on the bars are only scaled by value for the sake of visual interest.)


Next year's name list starts off with Alex, Bonnie, and Colin.  Two new names appear on the 2022 list:  Martin and Owen, which replace Matthew and Otto from 2016.

31 October 2021

Trick or Treat? October ends with Wanda


What is now Subtropical Storm Wanda had its origins over Georgia six days ago, then was a potent Nor'easter a few days later, and then transitioned from an extratropical cyclone to a subtropical cyclone, earning a name in the process.  Wanda is the season's 21st named storm, and the last on the regular list of names.  Victor was the last named storm to form in the Atlantic (until now), and that was named way back on September 29th!


Wanda won't be affecting land in its future, but has peak sustained winds of 50 mph and is located about 1800 miles east of North Carolina and 1900 miles west of southern Portugal -- truly the middle of Atlantic!  It is not forecast to reach hurricane intensity, and should transition back to an extratropical cyclone by the end of the week.

The cumulative ACE (Accumulated Cyclone Energy) is at about 143% of average for the date, and Wanda won't contribute too much more to the overall tally.


With one month remaining in the official Atlantic hurricane season, there's a chance that Wanda won't be the last.  If anything should form, we'll switch over to the auxiliary list, shown below.  This list was chosen to replace the use of the Greek alphabet.  Only 2005 and 2020 ever exhausted the regular list of 21 names before, so to happen in two consecutive years now is extraordinary!


There is actually an easterly wave that just left the African coast, and NHC is giving it a 30% probability of becoming a tropical cyclone in the next five days.  It has been tagged as Invest 95L.  This would be a very late-season Cabo Verde storm should it form.


05 October 2021

Hurricane Sam clinches its place in history books

Hurricane Sam finally transitioned to a powerful extratropical cyclone on Tuesday morning, and no other tropical cyclones are active or brewing.  Through today, there have been 20 named storms in the Atlantic this season, including 7 hurricanes and 4 major hurricanes.  Of those four major hurricanes (Category 3+), two made landfall at their peak intensity: Grace and Ida.

Sam ended up producing an astounding 53.8 ACE (Accumulated Cyclone Energy) units, which singlehandedly accounts for 39% of the season's total so far!  It also clinched 5th place for most energetic storm in the Atlantic (during the reliable satellite era, and pending any post-season reanalysis tweaks to its intensity).  This table shows the new Top 10 list, using storms from 1966-2021.


Also during the satellite era, which is conventionally defined as 1966 onward, very few seasons have had as much ACE accrued by October 5th as the 2021 season: 1995, 2003, 2004, 2005, and 2017... all high-end infamous hurricane seasons.  ACE is a metric that doesn't depend on the number of named storms, only the overall intensity and duration of whatever storms form.


The only name remaining on the regular list is Wanda, then we would move into the new auxiliary list that replaced the Greek alphabet.  I shared this list of names in my post on September 28th, but here it is again as a refresher:


October can still be a potent month for hurricanes, so it's absolutely too soon to tune out the tropics.  Category 5 hurricanes such as Mitch '98, Wilma '05, Matthew '16, and Michael '18 occurred during October.  Sandy '12 was also born in the western Caribbean in late October and reached peak intensity as a Category 3 hurricane when it made landfall in eastern Cuba.

As we see in this map of climatological hurricane activity, south Florida is especially at risk during October due to the prevailing steering patterns and preferred formation zones. And unlike the long-track storms of African pedigree, storms that form in the western Caribbean Sea or Gulf of Mexico naturally give less lead-time for impacts.


30 September 2021

Wrapping up September with 20 named storms

Hurricane Sam continues is trek over the open ocean north of the Lesser Antilles, still as a formidable Category 4 hurricane.  It has persisted as a Category 3-4 hurricane Saturday morning, and will probably remain at that intensity for another couple of days until it starts to find cooler water and strong vertical wind shear. 


Sam is forecast to pass just east of Bermuda, and the island is under a tropical storm watch.  Then it will gradually transition to an extratropical cyclone by the middle of next week and will be a potent player in the north central Atlantic, including the UK perhaps, eventually.

On Wednesday afternoon, the tropical wave near the coast of Africa, Invest 90L, was upgraded to Tropical Depression 20, then to Tropical Storm Victor six hours later.  The only other year to have 20 named storms form before October was 2020.


Victor is an impressively large circulation -- much larger than Sam was when it exited the continent.  And it also became a tropical storm REALLY far south at 8.3N... the only other storm to form farther south than Victor was Kirk in 2018 (8.1N).  Bret in 2017 is a close contender, as it became a wave with tropical storm force winds at 7.8N but wasn't officially a tropical storm until 9.2N.

If this had formed a couple weeks sooner, its odds of being a long-track deep-tropics hurricane would be really good, but that gets harder to do this late in the season.  The NHC forecast is in good agreement with the the models, which takes Victor toward the northwest and over cooler waters within a week.


Victor has a shot at becoming a hurricane on Friday, but after that the window of opportunity begins to close on it.  If it does, it would be the season's 8th hurricane, and recent seasons with an 8th hurricane on or before October 1 are 2020, 2017, 2012, 2005, 1995...

As of now, there are not any other areas of interest, but October can be a busy month, and we tend to see development much closer to land: the western Caribbean, Gulf of Mexico, and off the southeast US coast. Only one more name is left on the regular list: Wanda... then we move to the new auxiliary list that I mentioned in Tuesday's post.


28 September 2021

Sam still a major hurricane, Victor and Wanda on the horizon?

As of Tuesday morning, the 2021 hurricane season has accrued as much ACE (Accumulated Cyclone Energy) as an entire average season would, and it is not even October yet.  Moreover, only two names remain in the regular name list -- Victor and Wanda -- and they are likely to get used within the next few days.  The extraordinary combination of exhausting the regular name list and having a full season's worth of ACE prior to October 17th has happened just once before, and that was just last year!  It took the mega 2005 season until October 17th to achieve that.


Sam has been a Category 3-4 hurricane since Saturday morning, and probably will be for another five days or so.  Its intensity peaked on Sunday night, when according NHC's "best-track" data, it was just a sneeze away from Category 5 status (and the post-season reanalysis could find that it did indeed make it).  The maximum sustained winds were 155mph, and 160mph is the Category 5 threshold.


The track and intensity forecasts for Sam have become remarkably uniform across models, so it should continue to be a well-behaved hurricane.  The NHC forecast shown below is very similar to all of the model guidance: a turn to the north later in the week as it gets picked up by a mid-latitude trough, perhaps passing east of Bermuda (could be close), all the while maintaining Category 3-4 intensity. So in the coming week, the only areas that need to be concerned are Bermuda (Saturday) and Newfoundland (Monday).


The next two areas of interest are both easterly waves and are both in the far eastern Atlantic, so I'll address them together.  The western one is tagged as Invest 91L and the eastern one is 90L; both left the continent at a very low latitude. It's actually hard to distinguish them in this satellite image, but there are two waves in there, more or less on the ends of the strip of clouds.


The latest European model ensemble suggests that both are likely to develop, so it could be a race to the final two names on the list (Victor and Wanda), but also that neither of them are threats to land any time soon, if ever.  It's too soon to be confident in any final outcome, but there's plenty of time to watch.


And finally, the remnants of Peter are actually still lurking.  Peter dissipated as a tropical cyclone six days ago, but the remnant vortex did not, and it could make a comeback this week.  It's about 350 miles east of Bermuda, and *if* it reforms, it would zip off to the northeast and probably only last a day or two, so it's really not of much concern.  Peter came from an easterly wave that left Africa on September 13th!


So, if Victor and Wanda are used in the near future, the end of the regular list is upon us yet again.  When that happened in 2005 and 2020, the Greek alphabet served as the auxiliary/overflow list (Alpha, Beta, Gamma, Delta, etc) but the use of the Greek alphabet was discontinued permanently after the 2020 season, so the World Meteorological Organization created a list of 21 auxiliary names that will be used, starting over with A: 


26 September 2021

Sam rapidly intensifies to Category 4 hurricane

Not surprisingly, Sam did indeed strengthen significantly over the past couple of days.  As of Sunday morning, it's a Category 4 hurricane... three days ago it was a tropical depression!  It is also the season's 4th major hurricane (Category 3+) now; Grace, Ida, and Larry were the other three.


There is a whole spectrum of intensification rates of course, from very slow to very fast.  Conventionally, the top 5% of rates is given the designation "rapid intensification" which corresponds to an intensity increase of at least 35mph in a 24-hour period.  The National Hurricane Center provides advisories with intensity estimates every six hours, so a new 24-hour period begins every six hours.  Sam experienced a total of seven RI periods, five of which were consecutive!  (in this table, the intensity is given in knots (nautical miles per hour)... 1kt=1.15mph... and RI periods are highlighted in red)


While that peak rate of 45 kt in 24 hr is impressive, it is very far from a record.  The record-holder in the Atlantic is Hurricane Wilma in 2005: 95 kt in 24 hr.  The record anywhere in the world belongs to Hurricane Patricia (East Pacific, 2015): 105 kt in 24 hr.

Of course, the ACE (Accumulated Cyclone Energy) is exploding due to Sam, and it will surpass the value that a full average season accrues on Tuesday... before October even starts!  By the end of the day, it will be at about 124% of average for the date.


Now on to the forecast.  Model guidance continues to show Sam turning north before reaching the Caribbean islands, then continuing northward.  It's not in any rush, so we'll still be dealing with  Hurricane Sam for at least another week.  In this new product from OU grad student Tomer Burg, a super-ensemble plot shows the track spread valid next Sunday morning.  By "super-ensemble", I mean this includes members from three different global model ensembles as well as their deterministic runs: GFS, ECMWF, and UKMET... a total of 118 members. (aside: this is a very nice product... I remember it being talked about 15 years ago as a way to replace the static "cone of uncertainty" with a dynamic one, the issues are timeliness and reliability)

Sam is about to leave an area of low ocean heat content and pass over much higher ocean heat content in the coming five days.  All of the rapid intensification that just occurred was over low OHC!  A slow-moving very strong hurricane requires high OHC to sustain itself.  OHC is integrated energy, so it's far more useful than just the sea surface temperature.  Big hurricanes really churn up the ocean, upwelling water from below.  If that water is cool, the hurricane will weaken, but if the warm water is deep, very little weakening will occur.  I overlaid the current NHC forecast "cone" on the OHC map below.


In short, Sam is not a threat to land any time soon, but is forecast to remain a major hurricane for probably another week or so.  It's definitely one to watch in Bermuda.

Elsewhere across the basin, there are some areas of interest. One is former-Peter near Bermuda which has a small chance of re-development, another is a wave in the deep tropics that doesn't look so healthy, and the most likely area to watch is an easterly wave that's still over western Africa.


That wave over Africa is strongly favored to develop by long-range model guidance. It's a really long way from anything, but it's worth introducing. The next name on the list is Victor.


By the way, if you missed yesterday's post, please check it out: I highlight this blog's 25th anniversary and the 20th anniversary of my "Tropical Cyclone Radar Loops" webpage!

25 September 2021

"Tropical Cyclone Radar Loops" Turns 20

Twenty years ago today, the "Tropical Cyclone Radar Loops" webpage was born.  It is strange for me to think about, but on September 25th, 2001, some current college students were not born yet!

Radar image of intensifying Hurricane Dolly on the morning of July 23, 2008.  The dramatic eyewall configuration and evolution was documented in a 2012 paper: "Observed Inner-Core Structural Variability in Hurricane Dolly (2008)".

I was just a few months out of graduate school, and had been hunting for archives of radar coverage of hurricanes making landfall for many months as I was really interested in polygonal eyewalls and mesovortices (poster from December 2000, paper from December 2002). I was at Colorado State University at the time, and asked around the large pool of tropical cyclone experts there, emailed colleagues, etc. -- no luck. Radar images were available in real-time on some websites of course, but even then they only displayed the most recent couple of hours at best.

36-hour radar loop of Category 5 Hurricane Maria crossing the Leeward Islands on September 18-19, 2017.

I begrudgingly concluded that no such resource existed, so I created one.  Of course, I had to write all of the scripts that would handle this task, so that was Step 1. Step 2 was getting people to know that it finally existed!  The webpage would be a home for current radar loops/animations of active storms that were many hours or even days long, but then serve as an archive of those loops. Little did I know that I would still be adding to it twenty years later.

The first entry to the site was Typhoon Lekima as it was nearing Taiwan (see below). As of September 25, 2021, the archive contains 492 radar loops spanning 198 tropical cyclones using radars in 30 different countries.  It's certainly not a complete record of tropical cyclone landfalls, and it was never intended to be; but I try to capture them when possible.  I have been able to backfill some cases in rare instances, but for the most part, every loop in that archive was created and available online in real-time.

The first entry to the Tropical Cyclone Radar Loops webpage was this one of Typhoon Lekima making landfall in southern Taiwan in September 2001.

All of the loops are available as animated GIFs, and some are available in other formats too.  Through trial and error, this was the format that was the most universally compatible.  It works on desktop computers, laptops, smartphones, PowerPoint slides, and different operating systems.  The downside is that the file size can get quite large for long loops.

But over the past two decades, I have helped dozens of people who requested assistance with using a specific loop: making a subset of a large one, resizing a loop to make it more social media-friendly, creating one in a different format such as MP4, and so on.  So if you want something that's not exactly available on the website, let me know and I'd be happy to help if I can.

I hope people continue to find this resource as useful as I have!

One other milestone anniversary to share: the "Tropical Atlantic Update" blog (the one you're reading) turned 25 this month!  I started it partway through the 1996 hurricane season when I was a junior at Lycoming College, and had no intention of doing it again in 1997.  But I did, and again in 1998, and then there was no turning back.  From the beginning, the intent was to write brief public-friendly updates on activity in the tropical Atlantic.  For the casual coastal resident or even weather enthusiast, it would provide the information needed to keep tuned in to what's going on... what, when, and where the threats were, if any.

It actually began as an email distribution list, and people could request to be added to the list.  It quickly grew to several hundred people, so managing it got simpler when I transitioned it to a more proper "blog" (the term "weblog", or "blog" for short, didn't exist then). Sadly, I don't have any of the posts archived from 1996-2001, so the first post available on here is from July 2002.  All of this was also well before social media existed, and before the wealth of model guidance websites that we enjoy today existed.

Over these past 25 years, I have written about 1350 updates spanning 430 tropical cyclones. During that time period, 50 storm names have been retired, so there was certainly no shortage of impactful activity to write about.

In summary, I just want to thank everyone who reads this for their interest over the years.  I know some of you have been with me from the humble beginnings, so a special thank you for not tuning me out yet!


24 September 2021

Hurricane Sam expected to keep strengthening as it heads west


Rapid intensification is a specific term that we use to describe the upper end of tropical cyclone intensification rates -- roughly the top 5% or so.  That translates to an increase in intensity of at least 35 mph in a 24 hour period.  Sam just did that and became the season's 7th hurricane.  It was a tropical depression with 35mph peak winds yesterday morning and is a Category 1 hurricane with 75mph peak winds a day later.


The National Hurricane Center is forecasting Sam to become a Category 4 hurricane on Sunday, but there are error bars around that just like there are for track.  As it intensifies over very warm water and negligible vertical wind shear, it will be moving slowly around the southern end of the subtropical ridge, not even reaching the longitude of the Lesser Antilles until late next week!


Looking ahead a little bit, let's suppose Sam becomes a major hurricane on Saturday (Category 3+)... the list of years with four major hurricanes by September 25th during the satellite era is relatively short but impressive: 2017, 2010, 2005, 2004, 1999, 1996, 1969.  

There are still important differences among long-range models, and the NHC track tends to be a blend of them.  The Leeward Islands and eastern Greater Antilles should still be paying very close attention to Sam, as it could potentially impact those islands as early as next Thursday.  The latest ensemble forecasts from ECMWF and GFS are shown below for reference.


Six aircraft from NOAA and the Air Force will be flying through and around this hurricane nonstop starting on Saturday, and the data they collect get ingested into models, which should help to increase forecaster confidence in the guidance.

In one week, the two models have noticeably different depictions of the mid-level steering patterns, though both now suggest that Sam does not make a direct hit on the Caribbean islands (the ECMWF was showing that for many consecutive runs).


Aside from Sam, there are three other areas of interest with the potential to become tropical cyclones in the next five days: ex-Odette in the north-central Atlantic, an easterly wave that's still over Africa, and a non-tropical low near Bermuda.   When the time comes, the next name on the list is Teresa (and if you enjoy hurricane history, here's a tidbit on Twitter regarding the original set of six lists that we still use).


23 September 2021

Tropical Depression Eighteen (future-Sam) forms in deep tropics

Since my previous post on Monday, Peter and Rose have both fizzled out with little fanfare, they were both mid-range tropical storms that were around for 2.5 days.  The easterly wave that had just left the African coast is farther west now of course, and was upgraded to Tropical Depression 18 on Wednesday afternoon.


This latest tropical cyclone is all-but-certain to become the 18th named storm, Sam, and then the season's 7th hurricane after that. As we see in the satellite image above, the storm appears to be well-organized, though there is a lot of dry dusty Saharan air immediately to its north and east -- that has probably been limiting a more rapid intensification.  The depression is centered about 1800 miles east of the Lesser Antilles.

Over the next week, TD18/Sam is going to move relatively slowly around the subtropical High... but the exact strength and placement of that High (ridge) will determine how close it gets to the northern Lesser Antilles and eastern Greater Antilles.  The NHC forecast splits the difference between some models that keep it more to the south and some that are quicker to recurve it.  So the Leewards, Virgin Islands, and Puerto Rico should absolutely be paying very close attention to this, as it could be about a week away, but could also be a major hurricane at that point.


The latest example of that spread is illustrated by the European global model ensemble (ECMWF, left) and American global model ensemble (GFS, right) below.  While some forecasts among these two are fairly similar (the eastern part of the ECMWF spread and the western part of the GFS spread), the western part of the ECMWF spread has some serious implications for land impacts.


It's worth noting that over the past few days, the ECMWF deterministic runs have been far more consistent with the more western/southern track, while the GFS deterministic runs have drifted around more and have had a northern bias.

Anything beyond this 10-day timeframe shown above is not worth thinking about yet, as even this is clearly stretching the limits of predictability.

We're also still watching ex-Odette... yes, the Odette that became a post-tropical cyclone five days ago.  It's still out there in the north-central Atlantic between Newfoundland and the Azores, and has a shot at transitioning back to a subtropical or tropical low in the coming days as it moves south over warmer water.  It is not expected to drift back closer to land.


Future-Sam and even reborn-Odette should start contributing to the season's ACE (Accumulated Cyclone Energy) shortly, but in the meantime, the ACE as of today is down to 111% of average for the date.  If Sam were not in the cards, the 2021 season would cross the "average" line for the first time on October 1st.  To put the current ACE value in recent historical perspective, the 2017 season was 2.1x higher by now, and even 2020 was 1.3x higher by now.  The season with the most ACE by this date, 1933, was 2.6x higher by now and we likely missed some of the activity!