26 October 2013

Hurricane Mitch: 15 years later

With the combination of a dormant Atlantic right now and another significant anniversary today, I thought I'd write a short summary on Hurricane Mitch, one of the most intense, destructive, and deadly hurricanes in history.

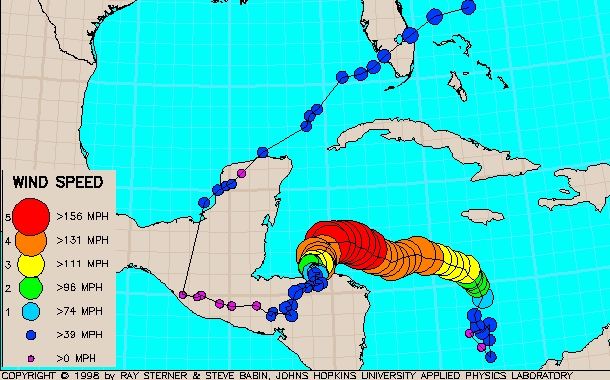
On October 26, 1998, it achieved tropical cyclone perfection in the western Caribbean with a peak intensity of 180 mph (and 905mb central pressure).


Not only was it so close to Honduras and Nicaragua at this intensity (strongest winds were still offshore), but it virtually STALLED, taking five days to drift onto and across Honduras.  In the track map below, the large red circles represent Mitch at its most intense, then it weakened as it drifted slowly southward to landfall.


Although the peak winds may have died down prior to official landfall, the rain did not.  Up to 3 feet of rain fell in southern Honduras, but extreme totals were recorded over much of Central America.... and 10"+ amounts were also recorded in many parts of Mexico and then an isolated area in southern Florida as well.  Unofficial local reports in Honduras were up closer to 6 feet of rain.  Mudslides and flooding were especially devastating in Honduras, where about 70% of the country lost power, fresh water, transportation, and communication.

Mitch was responsible for approximately 19,000 deaths across ten countries, but the vast majority were in Honduras (14,600).  It remains the second deadliest hurricane in Atlantic history, trailing slightly behind the Great Hurricane of 1780 that claimed over 22,000 lives in the eastern Caribbean.

Here's your opportunity to stare a Category 5 hurricane in the eye!  Back in 1998, I made a high-resolution visible satellite loop available that is zoomed in over just the inner core.  I know there are folks who were subscribed to my email list/blog back then who are still subscribed, and I remember sharing the details of this monster hurricane with you as it unfolded, including this satellite loop.


This year, at the end of October, we don't have a Mitch, Wilma, or Sandy to worry about... the Atlantic is quiet for now.


24 October 2013

Hurricane history: Sandy and Wilma

SANDY

One year ago this morning, Sandy intensified to a hurricane just south of Jamaica.  By the morning of October 25th, it rapidly intensified to a Category 3 hurricane with 115mph winds as it made landfall on the southeastern coast of Cuba.

Visible satellite image of Hurricane Sandy on the morning of October 24, 2012.
Model guidance was coming into better agreement on a track that would bring Sandy into the New Jersey coast as a very large cyclone on October 29th, possibly not tropical, but still very potent.  Below is a clip from my blog post one year ago:
"The ominous forecast by last night’s ECMWF deterministic run places an incredibly strong cyclone off the New Jersey coast on Monday evening... with tropical storm to hurricane force winds covering every state between Virginia and Maine. A scenario such as this would be devastating: a huge area with destructive winds, extensive inland flooding, possibly heavy snow on the west side, and severe coastal flooding and erosion."
To read the rest of that post, see Sandy strengthens to hurricane on approach to Jamaica; odds of East Coast impact grow

WILMA

Another significant hurricane anniversary is that of Hurricane Wilma in 2005.  On the morning of October 19th, Wilma smashed rapid intensification AND intensity records in the Atlantic when a reconnaissance plane found a central pressure of 882mb.  It went on to hit the Cozumel/Cancun area of the Yucatan peninsula as a high-end Category 4 hurricane, then turned sharply to the northeast with a bullseye on the Florida peninsula.

Wilma's track... intensity is color-coded, and dates are marked at 0000 UTC (the "24" marker is  0000 UTC on Oct 24, or 8pm EDT on Oct 23).
Eight years ago today, Wilma plowed into the southern tip of Florida as a Category 3 hurricane.  I have several long radar loops of Wilma available at http://andrew.rsmas.miami.edu/bmcnoldy/tropics/radar/index.html#wilma05, and a satellite image from shortly after landfall is shown below.


Nearly all of south Florida (west and east coasts) was without power after Wilma went through, and wind gusts over in the Miami/Fort Lauderdale/West Palm Beach area were in the 100mph range.  It left a swath of destruction and flooding from the Keys up to north of Lake Okeechobee.

Not only is it the 8-year anniversary of Wilma's landfall on Florida, it's also the 8-year anniversary of the last time a major hurricane made landfall ANYWHERE in the U.S.!  For a more detailed description of just how odd this major hurricane landfall "drought" is in the U.S., see my blog post from nine days ago: Tropics extremely quiet in Atlantic; record drought in major U.S. hurricane landfalls

As always, thanks for reading and sharing!


23 October 2013

Lorenzo, and an update on the season

On Monday morning, Tropical Storm Lorenzo formed in the middle of the Atlantic (it was initially Tropical Depression 13).  The closest reference point would be Bermuda, but it was even 650 miles southeast of that.  Today, Lorenzo remains a weak tropical storm, and is in a hostile environment with 30kts of vertical shear.  A recent satellite image shows an exposed surface circulation with all of the thunderstorm activity displaced well to the southeast.


As of 5am today, the intensity estimate was 45kts, and it's forecast to weaken/dissipate over the next couple of days.  It will remain very far from any land.  To put its location in another perspective, it's 1900 miles due east of Daytona Beach, FL... the same distance as it is between New York City and Salt Lake City.

As an aside, one year ago today I was writing about newly-formed Tropical Storm Sandy when it was south of Jamaica.  For a haunting trip down memory lane, here's my blog post from October 23, 2012.  Sandy's U.S. landfall occurred on October 29, six days after that post was written.

In the big picture, the season remains extremely quiet... one of the quietest on record.  Although we've had twelve named storms, there have been just two short-lived Category 1 hurricanes, and no major hurricanes (Cat3+).  Going back to 1950, only four other seasons had zero major hurricanes: 1968, 1972, 1986, and 1994.  Of course, this season isn't over yet and we could still have one or more major hurricanes, but as of now, 2013 joins this short list.  In terms of ACE, the season is at about 30% of an average season for this date, and there is nothing expected to form in the foreseeable future.


09 October 2013

South Florida hurricane climatology... and major hurricane landfall drought

I wanted to take today to revisit a post that I made last year... and is still just as relevant. The first part focuses on hurricane landfall climatology in south Florida, one of the most vulnerable and frequently-hit areas in the country.  The second part briefly takes a look at the continued absence of major hurricane landfalls on the U.S.

As we head further into October, the fifth month of the official Atlantic hurricane season, it’s very important for folks in south Florida to realize that this is the greatest hurricane risk month. More hurricanes directly hit or affect southern Florida in October than in any other month. In the graphic shown below, the gray circle is 300 miles across and centered on far western Broward County – designed to include all of southern Florida and immediate surrounding ocean. Any storm of hurricane intensity (sustained winds of 75mph+) whose center passed within that circle is shown in the colored lines, and the legend in the lower right corner associates the color with a category on the Saffir-Simpson scale (yellow is Category 1, orange is Category 2, etc). Finally, the coastal counties are shaded by historic landfall frequency, with darker reds corresponding to more frequent, and pale reds corresponding to less frequent. The monthly tally of tracks passing through the circle is indicated in parentheses below the month. Keep in mind that all of these storms were hurricanes – tropical storms and depressions are not included; and most importantly, never focus on exactly where the center of the track is. Destructive winds, tornadoes, flooding rains, and inundating storm surges can and do occur for hundreds of miles away from the center; so even tracks on the fringe of the circle likely brought severe weather conditions to the mainland.


Another interesting aspect of these maps is that in August and September, southern Florida is most likely to get struck by a storm coming from the southeast. But in October, the dominant direction is from the southwest… due to storms coming from the Gulf of Mexico and western Caribbean, the more favored areas for hurricane formation later in the season.

On the topic of landfalls, do you remember the last time a major hurricane made landfall on the U.S.? It was Hurricane Wilma, on the morning of October 24, 2005, and it hit southwestern Florida at Category 3 intensity. That was 2,908 days ago, an utterly unprecedented span between major U.S. hurricane landfalls. 


Going back to 1900, this graph shows the number of days between consecutive major hurricane landfalls on the U.S.  This helps to put the current span in perspective.  (Adapted from http://rogerpielkejr.blogspot.com)
Streaks that even approach this long are very rare, and only two other spans of over 2,000 days have occurred since 1900. Why has it been so long? Pure luck. There have been several major hurricane landfalls since 2005 in other countries (Nicaragua, Mexico, Cuba, Virgin Islands, Bahamas, and close encounters in Jamaica and Belize), so it definitely isn’t correct to say that seasons since 2005 have been quiet … far from it. No one knows exactly when our lucky streak will end, but I can say with 100% certainty that it will end eventually!

If one does not occur during the remainder of the 2013 season, then looking ahead to August 1, 2014 (for example) would bring the span up to 3,204 days.


05 October 2013

Karen getting ripped apart before landfall

Wind shear and dry air have persistently whittled away at Tropical Storm Karen.  The surface circulation is now exposed almost entirely... the only deep convection to be found is 80+ miles to the southeast.  Karen will pose only a minimal threat to the northern Gulf coast when it comes ashore early Sunday morning.


Enhanced infrared satellite image of Karen from 7:45am EDT.  I marked the storm's center with a red X to help you find it.  (NOAA)

The wind shear (difference in wind speed and direction between low levels and upper levels of the atmosphere) is up near 30kts this morning, and may decrease to 20kts or so this evening, then ramp up to 50kts+ as it gets absorbed by a mid-latitude trough and cold front.  Generally, shear over 20kts is toxic to a tropical cyclone.

Dry air also continues to infiltrate the storm's circulation... even without shear, that can be enough to choke the life out of a tropical cyclone, after all, the fundamental mechanism that drives them is latent heat release (the energy released when water vapor condenses into cloud droplets and rain).  The image below is a model analysis from this morning showing mid-level winds and relative humidity.  Karen is centered just south of eastern Louisiana, and the dry air (brown shades) can be seen swirling into it.

500mb winds and relative humidity from the 06Z NAM analysis. (twisterdata.com)
At 8am EDT, Karen was located 155 miles south of Morgan City, LA and heading north at 10mph.  It is forecast to make a turn to the northeast later today.  Peak sustained winds are estimated to be 40mph, but that could be generous... it's actually difficult to find observations to support that.  All hurricane watches have been discontinued, but tropical storm warnings remain in effect for most of eastern LA, and a tropical storm watch extends eastward to Indian Pass, FL (see map).  This section of the Gulf coast really dodged a bullet this time... Karen could have been so much worse (think Camille, Opal, Katrina, etc).

The latest watches and warnings, as well as the track forecast, can be found on the National Hurricane Center's website.

Early morning model analysis of surface winds, with weather station wind observations plotted.  Definitely not a big wind maker for anyone!  (wunderground.com)

Storm Surge
The storm surge danger has greatly diminished - the latest models suggest a slight chance of a 2-4' surge in the New Orleans area eastward to Biloxi. 

Tornadoes
As with any landfalling tropical cyclone, there is the possibility of tornadoes, and today's highest risk is extreme southeastern LA.

Inland Flooding
Since so much of Karen's moisture is already being dissipated, the rainfall expected from it in the coming days is also decreased.  The latest 5-day forecast from WPC shows most of the rain associated with Karen dwindling by the time its remnants reach Georgia.

I have long radar loops up and running which could be interesting, but as it looks now, it will just be disorganized heavy rain well to the east of the center.


03 October 2013

02 October 2013

Caribbean system may become Tropical Storm Karen and affect Gulf and East coasts

An update on the tropical disturbance in the western Caribbean is available on the Washington Post's Capital Weather Gang blog:

Caribbean system may become tropical storm Karen and affect Gulf and East coasts


Also, thanks to everyone who read, shared, and helped make Monday's blog post such a big hit.  Even amidst the major government shutdown news yesterday, that article was the 4th most popular item on the entire Washington Post website on Tuesday afternoon!


01 October 2013

Jerry falling apart, Karen in the works?

When Tropical Depression 11 formed on Saturday night, the outlook was never very bullish for it.  It was upgraded to Tropical Storm Jerry on Monday morning, but was heavily sheared and disorganized.  Today, it is still located in the central Atlantic (about 2200 miles east of Cape Canaveral FL, or 1500 miles west of the Canary Islands) and is losing a battle with very dry air and moderate shear.

Enhanced satellite image of TS Jerry from 7:15am EDT today.  Low clouds show up as yellow, and you can see the exposed low-level circulation center in the middle of the image. (NOAA)
At 5am EDT, the maximum sustained winds were estimated at 45mph, and it has basically stalled in place due to a lack of steering flow.  By the end of the week however, the shear may relax a bit and it should begin moving to the northeast, so IF it doesn't completely fizzle out (yes, that's technical) by then, it could hang around as a weak tropical storm through the weekend... still very far away from any land.

Strength (colors) and direction (white lines) of the current steering flow for Tropical Storm Jerry.  It is stuck in a col between ridges. (CIMSS)

Elsewhere, a persistent area of disturbed weather over the central Caribbean Sea has been festering for nearly a week.  Today, it has migrated a little further west and is centered near the Honduras/Nicaragua border.


Although it's disorganized now, the environmental conditions generally favor gradual development in the near term.  If it reaches tropical storm intensity, the next name on the list is Karen.  By the weekend, it is expected to move into the Gulf of Mexico and be greeted by very dry air and increasing vertical wind shear.  The latest batch of model guidance is in good agreement on a track toward the Yucatan peninsula, then into the central Gulf, then somewhere along the northern Gulf coast.  The timing varies greatly among the models, so there's still large uncertainty.  Though some of these track forecasts may be alarming, NONE of the guidance currently indicates that this will reach hurricane intensity, and by the time it reaches the U.S. coast, its largest impact will likely be heavy rain.

Track model guidance from the 06Z run today.  (U of Wisconsin-Milwaukee)
Stay tuned for any developments -- we need to watch this Caribbean disturbance very closely... the western Caribbean and southern Gulf are climatologically favored regions for hurricane formation in early October!